A reminder that the 2026 NSF Unidata Community Equipment Awards solicitation is open until March 27, 2026. Created under the sponsorship of the U.S. National Science Foundation, NSF Unidata equipment awards are intended to encourage new members from diverse disciplinary backgrounds in the Earth Systems Sciences to join the NSF Unidata community, and to encourage existing members to continue their active participation, enhancing the community process. For 2026, a total of $100,000 is available for awards; proposals for amounts up to $20,000 will be considered.
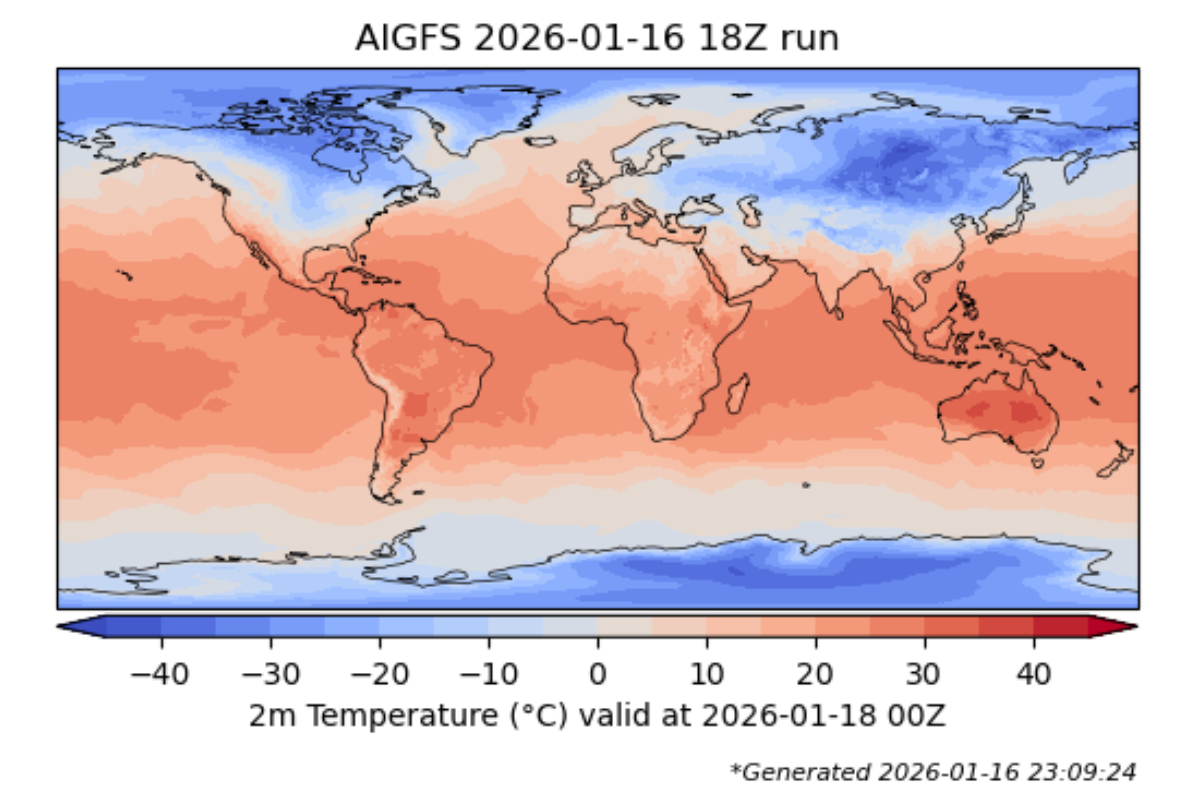
In partnership with the NOAA/NWS National Centers for Environmental Prediction (NCEP) through the Cooperative Opportunity for NCEP Data Using IDD Technology (CONDUIT) program, the NSF Unidata Program Center is pleased to announce the availability of artificial intelligence (AI)-driven global weather prediction model output in NSF Unidata datastreams.
NFS Unidata will be updating the underlying server technology for our Maven artifacts server (artifacts.unidata.ucar.edu) on Tuesday, January 20th, around 12:00 MST (UTC-7). While internal testing using both Maven and Gradle indicates that the transition should be transparent, users are encouraged to reach out to support if they encounter any issues.
Do you know someone in the NSF Unidata community who has been actively involved and helpful to you and other NSF Unidata members? Perhaps this is someone who volunteers to assist others, contributes software, or makes suggestions that are generally useful for the community.
The NSF Unidata Users Committee invites you to submit nominations for the Russell L. DeSouza Award for Outstanding Community Service. This Community Service Award honors individuals whose energy, expertise, and active involvement enable the NSF Unidata Program to better serve the Earth Systems Sciences community. Honorees personify NSF Unidata's ideal of a community that shares ideas, data, and software through computing and networking technologies.
Members of the NSF Unidata Program Center staff will be attending the 106th annual American Meteorology Society meeting, to be held 25-29 January 2026 in Houston, TX.
Planned maintenance to some Jetstream2 infrastructure will require NSF Unidata's EDEX servers, JupyterHubs, and TDS Nexrad to be off-line temporarily on Friday, January 2, 2026. Maintenance will occur approximately between 6:00am and 6:00pm Eastern Time.
The NSF Unidata Summer Internship offers undergraduate and graduate students an opportunity to work with NSF Unidata Program Center staff on software development projects drawn from a wide variety of areas in the atmospheric and computational sciences. Apply for the 2026 internship by 6 February 2026.
The FARR Workshop 2026, April 8-9, 2026 at the AGU Conference Center in Washington DC, aims to make advances in the areas of AI Readiness, AI Reproducibility, and the intersection of the FAIR Principles and ML.