The NSF Unidata THREDDS development team is happy to announce the release of version 5.10.0 of the netCDF-Java/Common Data Model (CDM) library. This release contains a number of enhancements, bug fixes, and 3rd party dependency updates. New features include support for Blosc compression, object storage support for feature collections (primarily focused on GRIB), and the generation of Software Bill of Materials (SBOMs) for uber-jars (e.g., netcdfAll, ncIdv, toolsUI) using the CycloneDX standard.
The 107th American Meteorological Society Annual Meeting in will be held 10-14 January 2027 in Denver, CO. The American Geophysical Union's 2026 Fall Meeting in will be held 7-11 December 2026 in San Francisco, CA. Abstract submission deadlines for both are in early August 2026.
In early 2026, the NSF Unidata Users and Strategic Advisory committees voted to approve a new organizational structure for the bodies that provide the Program with advice and guidance. Beginning with meetings in the fall of this year, the existing committees will be combined into a Community Advisory Committee that will welcome members from academia, the commercial sector, federal scientific agencies, charitable organizations, and beyond.
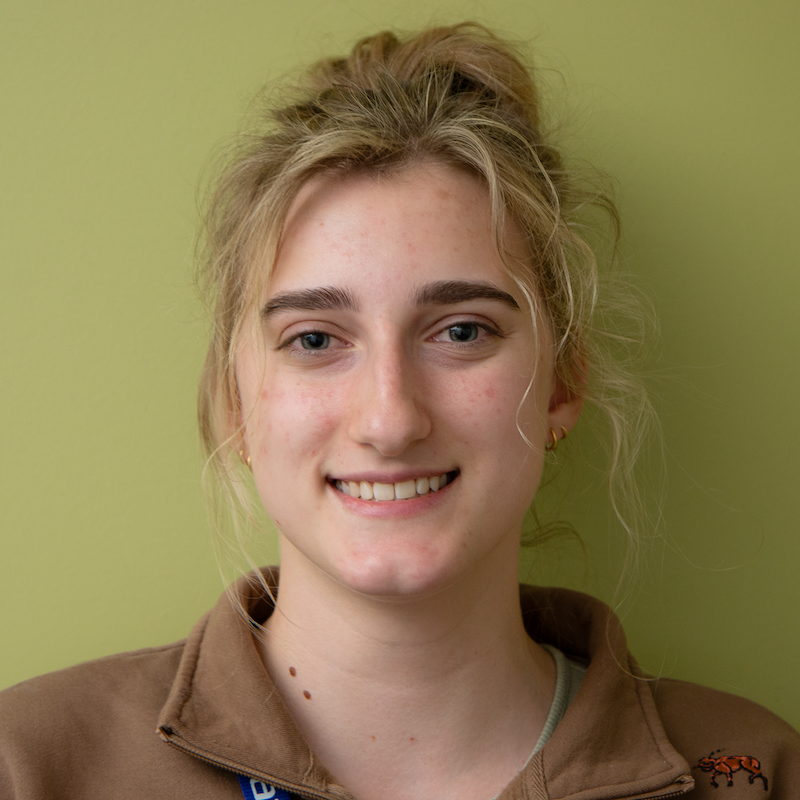
Tara Staresinic joined the NSF Unidata Program Center as a student summer intern on May 18, 2026. This fall, Tara will be a senior at Penn State University, majoring in Meteorology and Atmospheric Science and minoring in computational science and German.
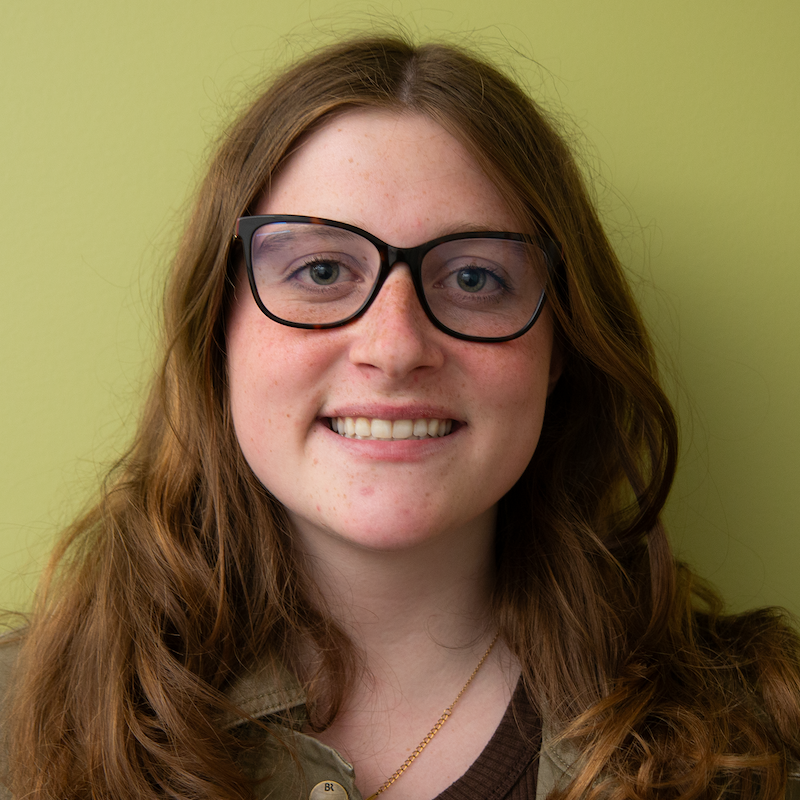
Sarah Ravellette joined the NSF Unidata Program Center as a student summer intern on May 18, 2026. This fall, Sarah will be a senior at the University of California, Berkeley, where she is pursuing a degree in Atmospheric Science.