[
Date Prev][
Date Next][
Thread Prev][
Thread Next][
Date Index][
Thread Index]
[Support #APU-620047]: Re: Upper Level color fill
- Subject: [Support #APU-620047]: Re: Upper Level color fill
- Date: Wed, 14 Feb 2007 15:31:28 -0700
Hi Bob-
> I got it figured out thanks.
>
> The only other issue I`m having, again related to upper level colour fills
> contours. Whenever I try and plot a colour fill at the upper levels, for
> example 850hpa, it plots some ragged contours but no colour fill
>
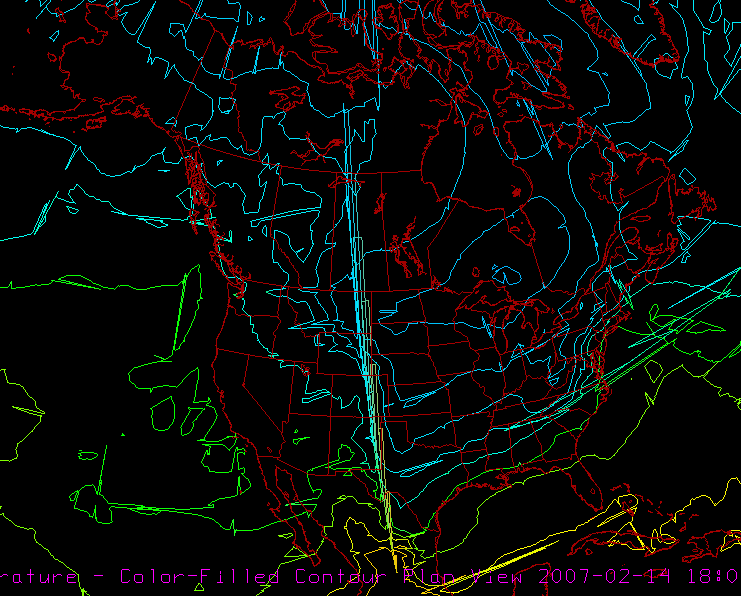
> Here`s an example
> http://i93.photobucket.com/albums/l54/bazwxman/contour_mess.png
That's quite a mess!
> It doesn`t seem to matter what model or from what source, they all turn out
> the same!
I'm unable to recreate that jagged problem here, however, I'm also unable to
display
color filled contours in the 2D display. So, if you want color filled contours,
you'll need to use a 3D display until we can get that fixed.
As for the jagged lines, the only thing I can think of is to make sure you have
the latest video driver for your graphics card.
Don Murray
>
> On 2/13/07, Bob Grieves <address@hidden> wrote:
> >
> > Hi Don,
> >
> > Thank you.
> >
> > All I`m simply looking to achieve is a color fill of the geopotential
> > heights for example at 500hpa, exactly the same as they use at Unisys, COD
> > etc etc http://weather.unisys.com/ecmwf/ecmwf_500p_3d.html
> >
> > I`m not sure whether I went about that the right way or not.
> >
> > To achieve this would I:
> >
> > Download grib data for example, NAM conus 80km. Select 3D grid, choose my
> > parameter which would be geopotential height. Then select the level and
> > time, then plan views/colour fill contour, then simply create display?
> >
> > Thank you,
> > Bob.
> >
> >
> > On 2/13/07, Don Murray <address@hidden> wrote:
> > >
> > > One more note. If you don't really care about it being
> > > a 3D application, you can also use the Edit->Preferences
> > > menu, select the Main Display tab, uncheck the "Use 3D if Possible"
> > > option, apply the preferences and then use the New->Display \menu to
> > > open a new Map Display. That will not be 3D and any upper level
> > > plot you put in there will have the map on top.
> > >
> > > Of course, that defeats the purpose of having a 3D application
> > > to look at the atmosphere in new ways. ;-)
> > >
> > > Don
> > >
> > > Don Murray wrote:
> > > > Hi Bob-
> > > >
> > > > Bob Grieves wrote:
> > > >> I seem to be running into a problem creating color-fill contoured
> > > >> plots at
> > > >> various isobaric levels. I have tried data from both the GFS and NAM
> > > >> 80km,
> > > >> and other gridded domains, however all the color-fills come out solid
> > > >> hence
> > > >> the basemap is not visible. Now 2D color fills seem just fine, I can
> > > >> plot a
> > > >> color fill for 2M and 10M temperatures and can see the basemap,
> > > coasts
> > > >> etc.
> > > >> The issue is upper levels (3D).
> > > >
> > > > It's a 3D display, so the upper levels are above the bottom
> > > > of the cube, thus the base map is hidden. You can rotate
> > > > the box to see the map underneath. You can also use the
> > > > Background Maps control to move the map up higher in the box.
> > > > You could also use the Displays->Background Maps menu to
> > > > add in a second set of maps and place that at the top.
> > > > You could also use the color table editor to adjust the transparency
> > > > of the level. However, transparency is problematic as only
> > > > the last thing loaded (or the one that has had the View->To Front
> > > > option used) will be transparent.
> > > >
> > > > Good luck!
> > > >
> > > > Don
> > > > *************************************************************
> > > > Don Murray UCAR Unidata Program
> > > > address@hidden P.O. Box 3000
> > > > (303) 497-8628 Boulder, CO 80307
> > > > http://www.unidata.ucar.edu/staff/donm
> > > > *************************************************************
> > > >
> > > >
> > > >
> > > ===============================================================================
> > > >
> > > > To unsubscribe idvusers, visit:
> > > > http://www.unidata.ucar.edu/mailing-list-delete-form.html
> > > >
> > > ===============================================================================
> > > >
> > >
> > > --
> > > *************************************************************
> > > Don Murray UCAR Unidata Program
> > > address@hidden P.O. Box 3000
> > > (303) 497-8628 Boulder, CO 80307
> > > http://www.unidata.ucar.edu/staff/donm
> > > *************************************************************
> > >
> > >
> > >
> >
> >
> > --
> > Bob Grieves
>
>
>
>
> --
> Bob Grieves
>
>
Ticket Details
===================
Ticket ID: APU-620047
Department: Support IDV
Priority: Normal
Status: Open