New in IDV: Direct Access to the NEXRAD AWS Archive
With an upgrade to the netCDF-Java library, the Unidata Integrated Data Viewer (IDV) can now directly access NEXRAD AWS Archive of archived Level II radar data. The archive contains decades of high-resolution radar observations that scientists use to investigate storm structure and examine storms in three dimensions. With this new capability, users can access the data directly within IDV with just a few clicks.
A Bigger Pool of Data for Everyone
The NEXRAD AWS archive has made decades of historical U.S. radar observations available to researchers. By integrating direct access into IDV, we make this resource easier for the entire IDV community to explore, including students and researchers who may not have established workflows for accessing the data.
Built for the Classroom and Research
This capability is particularly valuable for students, instructors, and researchers. Whether a class is investigating a major storm or a student is pursuing an independent research project, users can now explore detailed radar observations directly in IDV without having to build a separate data-access workflow.
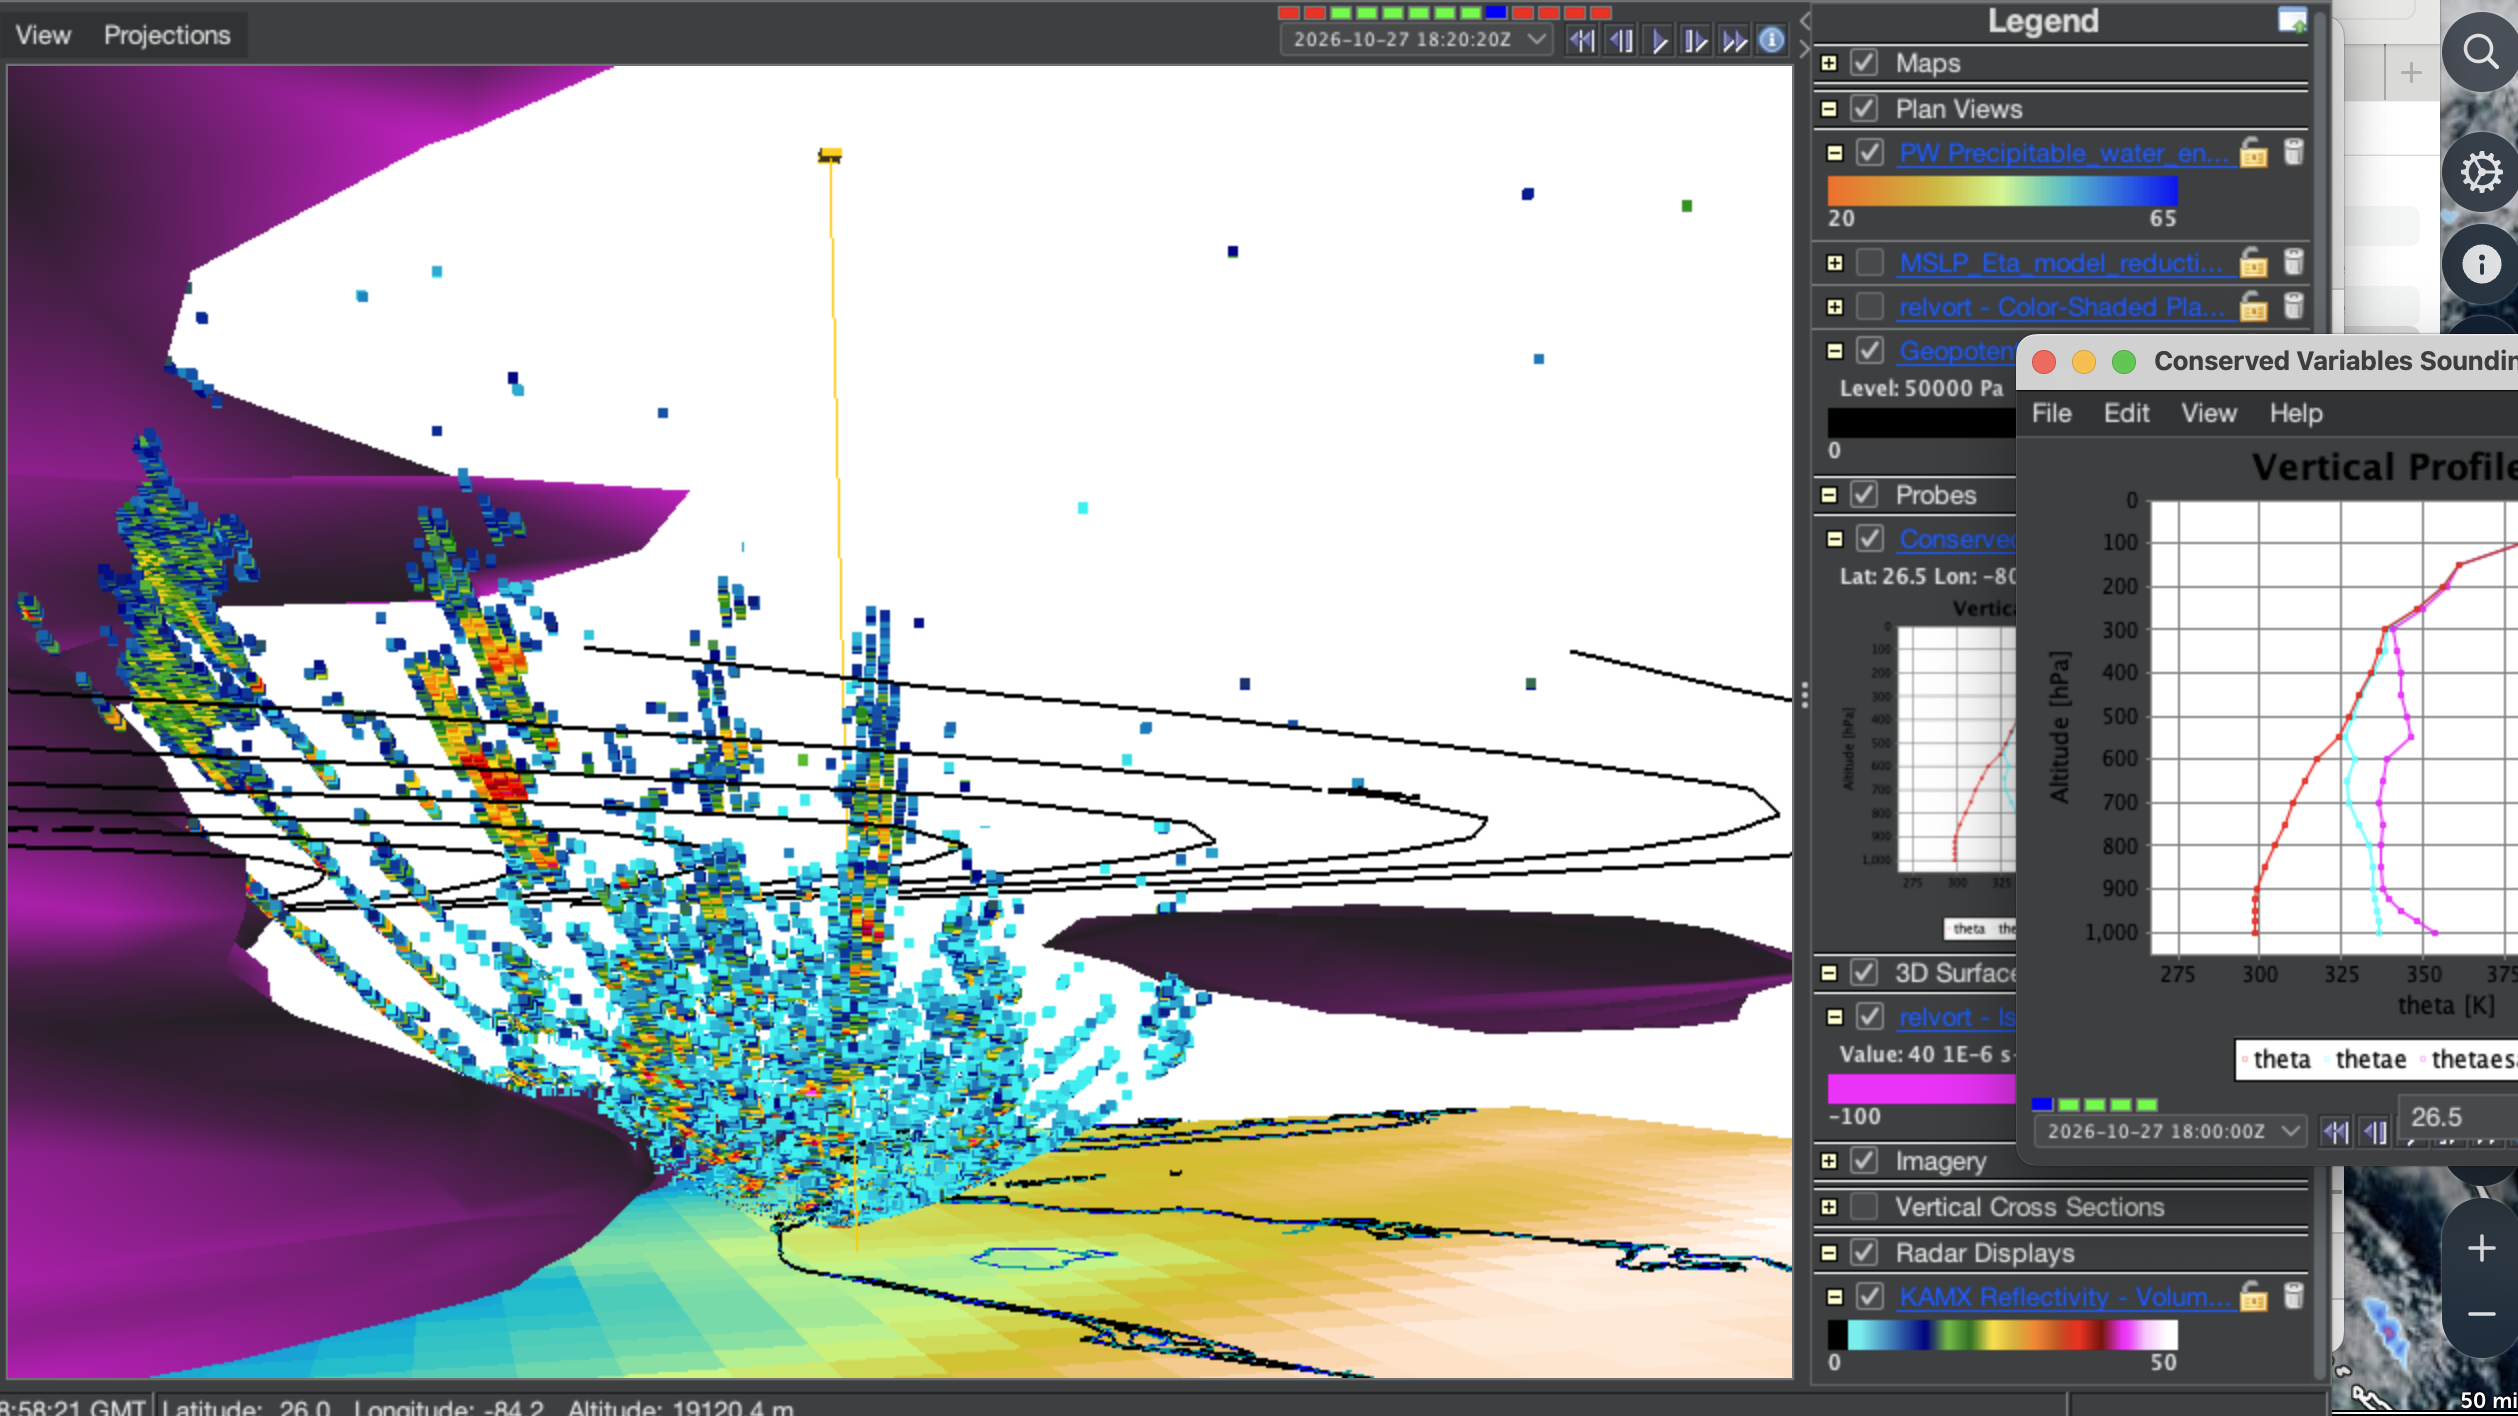
Brian Mapes' visualization of the cyclonic vorticity wall in Hurricane Helene, showing a 3D radar sweep integrated with the conserved sounding, 500mb Z contours and vorticity isosurface.
The educational potential is already becoming apparent. While studying Hurricane Helene, which caused catastrophic flooding across the southeastern United States in September 2024, Professor Brian Mapes and his students noticed an unusual cluster of thunderstorms over Arkansas, far from the storm’s main rainband.
Traditional radar maps provide valuable two-dimensional views of storms. IDV’s three-dimensional visualization capabilities allow students to go further by examining vertical storm structure and investigating features that may not be apparent in a plan view alone. With direct access to historical radar observations, students can explore these events in greater detail and develop a deeper understanding of how storms form, evolve, and interact with their surroundings.
This is a powerful example of how easier access to scientific data, combined with interactive visualization, can create new opportunities for hands-on learning and discovery.
More data. Fewer barriers. More opportunities to explore!

Add new comment