G'day,Here's another example of the issue Tomas is talking about (from the MZmine software).
The artefacts appear when the sampling resolution along the m/z axis is high (attachment 1).
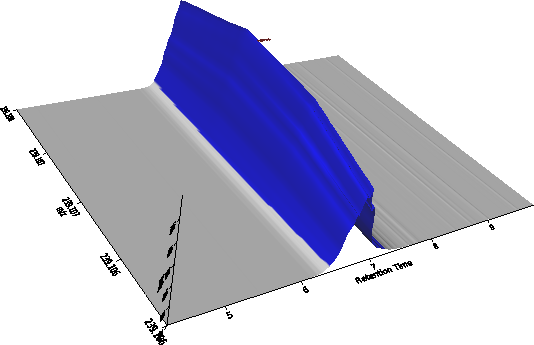
They're not present at lower resolutions (attachment 2).

Floating point precision could well be the issue.

Regards,
Chris.

On 22/05/12 08:11, Tomas Pluskal wrote:
Hi Tom,

Thank you for the tip.
I would like to try that, but what class should I use instead of the Linear2DSet? There seems to be only Gridded2DDoubleSet, but no equivalent for the linear set.By the way, please check the other batch of screenshots I sent: http://www.unidata.ucar.edu/mailing_lists/archives/visad/2012/msg00057.html There the same issue appears although the spacing between the data points is not so close (around 1).Tomas On May 21, 2012, at 10:41 PM, Tom Rink wrote:Hi Tomas, With the Linear2DSet you've defined, the points are pretty close, maybetoo close for single precision. You could try the double-precision versionof the Set classes. Tom=============================================== Tomáš PluskalG0 Cell Unit, Okinawa Institute of Science and Technology Graduate University1919-1 Tancha, Onna-son, Okinawa 904-0495, Japan TEL: +81-98-966-8684 Fax: +81-98-966-2890
This message may contain confidential information. If you are not the designated recipient, please notify the sender immediately, and delete the original and any copies. Any use of the message by you is prohibited.
Attachment:
peakHiRes.png
Description: PNG image
Attachment:
peakLoRes.png
Description: PNG image
visad archives: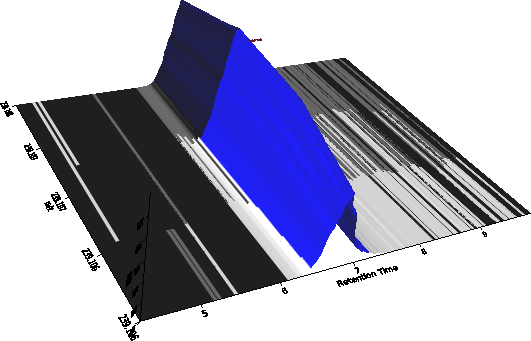