Greetings!
Thanks for the report. It looks like the problem is that this sounding has
a lot of levels, which pushes the larger height values beyond the 100 rows
that `pandas.read_fwf()` uses by default to autodetect appropriate column
widths. This has been fixed in https://github.com/Unidata/siphon/pull/696,
which will be released with siphon 0.9.1 (release date TBD). In the
meantime, if you need the fix available sooner, you can install siphon
directly from git with:
pip install git+https://github.com/Unidata/siphon
Cheers!
Ryan
On Mon, May 22, 2023 at 11:24 PM Geoffrey Lewen <geoffreylewen@xxxxxxxxx>
wrote:
> Hello,
>
> I recently encountered a situation in which the data returned by Siphon’s
> client for the University of Wyoming Upper Air archive contained invalid
> height data. (Please see below.)
>
> Thanks for any assistance or advice with this issue,
>
> Geoff
>
>
>
> -------------------------------------------------------------------------------
>
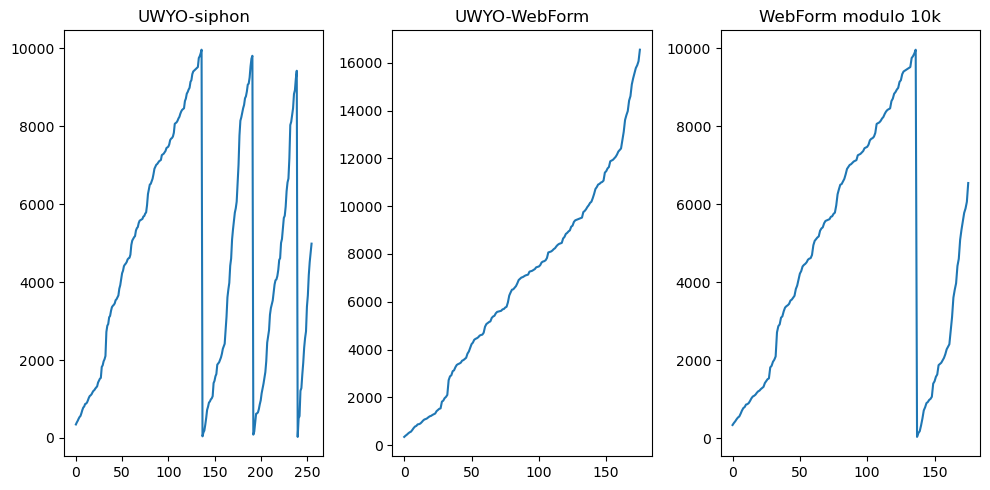
> SUMMARY: This involves the 5/22/2023 12Z RAOB for station OUN. The
> heights appeared to be the "actual heights modulo 10km”. The data in
> the U of Wyoming web form does not show any issue, nor is there a problem
> with the height when using Siphon to read the sounding from Iowa State.
>
> My MetPy/Siphon environment is
>
> • MetPy 1.5.0
> • Siphon 0.9
>
>
> Here is a simple example of code to reproduce the situation:
>
>
> -------------------------------------------------------------------------------
>
> from datetime import datetime
> import matplotlib.pyplot as plt
> import numpy as np
> from siphon.simplewebservice.wyoming import WyomingUpperAir
>
> Year = 2023
> Month = 5
> Day = 22
> Hour = 12
> date=datetime(Year,Month,Day,Hour)
> station = 'OUN'
>
> # Read height data
> df = WyomingUpperAir.request_data(date, station)
> Z1 = df['height'].values
>
> # Data extracted manually from the University of Wyoming Web form
>
> WebForm = np.array([ 345, 397, 440, 493, 537, 564, 635,
> 716, 779,
> 806, 870, 880, 907, 963, 1028, 1075, 1094, 1122,
> 1170, 1208, 1227, 1266, 1295, 1324, 1421, 1471, 1520,
> 1540, 1822, 1863, 1966, 2019, 2103, 2720, 2879, 2925,
> 3097, 3132, 3261, 3356, 3392, 3416, 3452, 3536, 3561,
> 3609, 3658, 3832, 3920, 4072, 4227, 4292, 4410, 4450,
> 4477, 4517, 4584, 4611, 4624, 4705, 4954, 5067, 5110,
> 5153, 5181, 5326, 5385, 5414, 5518, 5577, 5592, 5607,
> 5623, 5683, 5698, 5759, 5790, 5976, 6262, 6391, 6506,
> 6523, 6589, 6656, 6774, 6911, 6962, 7014, 7032, 7067,
> 7102, 7119, 7137, 7261, 7279, 7297, 7333, 7369, 7442,
> 7460, 7478, 7534, 7645, 7683, 7701, 7739, 7834, 8065,
> 8085, 8104, 8144, 8203, 8243, 8322, 8383, 8423, 8444,
> 8464, 8650, 8713, 8839, 8882, 8946, 8989, 9142, 9186,
> 9341, 9409, 9432, 9454, 9477, 9500, 9523, 9754, 9801,
> 9872, 9968, 10040, 10138, 10187, 10336, 10512, 10720, 10800,
> 10907, 10934, 10988, 11015, 11070, 11407, 11465, 11581, 11640,
> 11880, 11911, 11942, 12003, 12066, 12160, 12286, 12351, 12416,
> 12754, 13112, 13611, 13814, 13980, 14421, 14607, 15094, 15352,
> 15564, 15784, 15896, 16068, 16550])
>
> # Simple plot of the data. The third plot shows the "modulo 10k" of the
> Webform data for comparison.
>
> fig, axes = plt.subplots(nrows=1, ncols=3, figsize=(10, 5))
> axes[0].plot(z1)
> axes[0].set_title('UWYO-siphon')
> axes[1].plot(WebForm)
> axes[1].set_title('UWYO-WebForm')
> axes[2].plot(WebForm % 10000)
> axes[2].set_title('WebForm modulo 10k')
> fig.tight_layout()
>
>
> -------------------------------------------------------------------------------
>
> Output:
>
>
> [image: +P88Jbv7ya7TIAAAAAElFTkSuQmCC.png]
>
> _______________________________________________
> NOTE: All exchanges posted to Unidata maintained email lists are
> recorded in the Unidata inquiry tracking system and made publicly
> available through the web. Users who post to any of the lists we
> maintain are reminded to remove any personal information that they
> do not want to be made public.
>
>
> python-users mailing list
> python-users@xxxxxxxxxxxxxxxx
> For list information, to unsubscribe, or change your membership options,
> visit: https://www.unidata.ucar.edu/mailing_lists/
>
--
Ryan May
Unidata Deputy Director
UCAR
Boulder, CO