<html><head><meta http-equiv="content-type" content="text/html;
charset=utf-8"></head><body style="overflow-wrap: break-word;
-webkit-nbsp-mode: space; line-break: after-white-space;"><span
style="font-size: 14px;">Hello,</span><div><span style="font-size:
14px;"><br></span></div><div><span style="font-size: 14px;">I recently
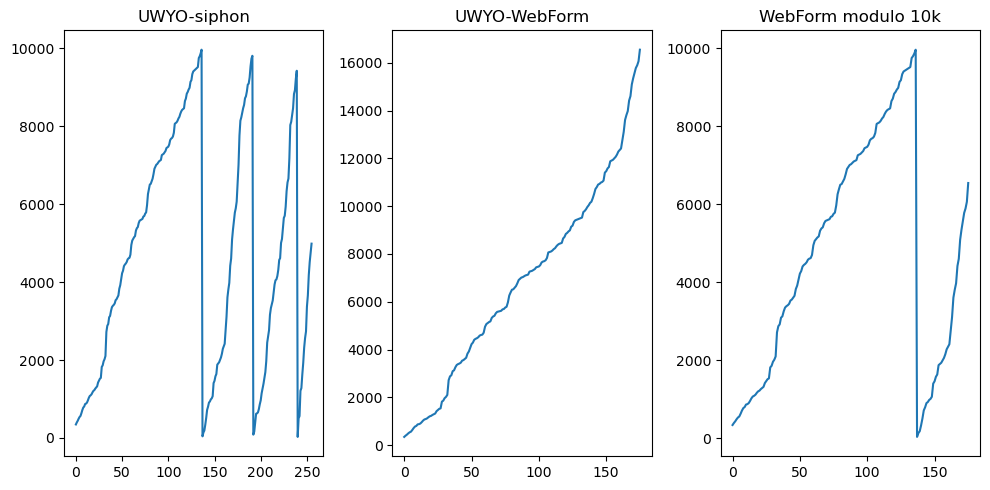
encountered a situation in which the data returned by Siphon’s client
for the University of Wyoming Upper Air
archive contained invalid height data. (Please see
below.)</span></div><div><span style="font-size:
14px;"><br></span></div><div><div style="caret-color: rgb(0, 0, 0); color:
rgb(0, 0, 0);"><span style="font-size: 14px;">Thanks for any assistance or
advice with this issue,</span></div><div style="caret-color: rgb(0, 0, 0);
color: rgb(0, 0, 0);"><span style="font-size: 14px;"><br></span></div><div
style="caret-color: rgb(0, 0, 0); color: rgb(0, 0, 0);"><span style="font-size:
14px;">Geoff</span></div></div><div><span style="font-size:
14px;"><br></span></div><div><span style="font-size:
14px;"><br></span></div><div><div><div style="caret-color: rgb(0, 0, 0); color:
rgb(0, 0, 0);"><span style="font-size:
14px;">-------------------------------------------------------------------------------</span></div></div></div><div><span
style="font-size: 14px;"><br></span></div><div><span style="font-size:
14px;">SUMMARY: </span><span style="font-size: 14px; caret-color: rgb(0,
0, 0); color: rgb(0, 0, 0);"> </span><span style="font-size: 14px;
caret-color: rgb(0, 0, 0); color: rgb(0, 0, 0);"> This involves the
5/22/2023 12Z RAOB for station OUN. </span><span style="font-size:
14px;">The heights appeared to be the "actual heights modulo 10km”.
T</span><span style="font-size: 14px;">he data in the U of Wyoming web form
does not show any issue, nor is there a problem with the height when using
Siphon to read the sounding from Iowa State. </span></div><div><span
style="font-size: 14px;"><br></span></div><div><span style="font-size:
14px;">My MetPy/Siphon environment is</span></div><div><span
style="font-size: 14px;"><br></span></div><div><span style="font-size: 14px;">•
MetPy 1.5.0</span></div><div><span style="font-size: 14px;">•
Siphon 0.9</span></div><div><span style="font-size:
14px;"><br></span></div><div><br></div><div><span style="font-size: 14px;">Here
is a simple example of code to reproduce the situation:</span></div><div><span
style="font-size: 14px;"><br></span></div><div><div style="caret-color: rgb(0,
0, 0); color: rgb(0, 0, 0);"><span style="font-size:
14px;">-------------------------------------------------------------------------------</span></div></div><div><span
style="font-size: 14px;"><br></span></div><div><div><span style="font-size:
14px;">from datetime import datetime</span></div><div><span style="font-size:
14px;">import matplotlib.pyplot as plt</span></div><div><span style="font-size:
14px;">import numpy as np</span></div><div><span style="font-size: 14px;">from
siphon.simplewebservice.wyoming import
WyomingUpperAir</span></div><div><br></div><div><span style="font-size:
14px;">Year = 2023</span></div><div><span style="font-size: 14px;">Month =
5</span></div><div><span style="font-size: 14px;">Day =
22</span></div><div><span style="font-size: 14px;">Hour =
12</span></div><div><span style="font-size:
14px;">date=datetime(Year,Month,Day,Hour)</span></div><div><span
style="font-size: 14px;">station = 'OUN'</span></div><div><span
style="font-size: 14px;"><br></span></div><div><span style="font-size: 14px;">#
Read height data</span></div><div><span style="font-size: 14px;">df =
WyomingUpperAir.request_data(date, station)</span></div><div><span
style="font-size: 14px;">Z1 = df<span style="caret-color: rgb(0, 0, 0); color:
rgb(0, 0, 0);">['height'].values</span></span></div><div><span
style="font-size: 14px;"><br></span></div><div><span style="font-size: 14px;">#
Data extracted manually from the University of Wyoming Web
form</span></div><div><span style="font-size:
14px;"><br></span></div><div><span style="font-size: 14px;">WebForm =
np.array([ 345, 397, 440, 493, 537,
564, 635, 716, 779,</span></div><div><span
style="font-size: 14px;"> 806, 870,
880, 907, 963, 1028, 1075, 1094,
1122,</span></div><div><span style="font-size: 14px;">
1170, 1208, 1227, 1266, 1295, 1324,
1421, 1471, 1520,</span></div><div><span style="font-size:
14px;"> 1540, 1822, 1863, 1966,
2019, 2103, 2720, 2879,
2925,</span></div><div><span style="font-size: 14px;">
3097, 3132, 3261, 3356, 3392, 3416,
3452, 3536, 3561,</span></div><div><span style="font-size:
14px;"> 3609, 3658, 3832, 3920,
4072, 4227, 4292, 4410,
4450,</span></div><div><span style="font-size: 14px;">
4477, 4517, 4584, 4611, 4624, 4705,
4954, 5067, 5110,</span></div><div><span style="font-size:
14px;"> 5153, 5181, 5326, 5385,
5414, 5518, 5577, 5592,
5607,</span></div><div><span style="font-size: 14px;">
5623, 5683, 5698, 5759, 5790, 5976,
6262, 6391, 6506,</span></div><div><span style="font-size:
14px;"> 6523, 6589, 6656, 6774,
6911, 6962, 7014, 7032,
7067,</span></div><div><span style="font-size: 14px;">
7102, 7119, 7137, 7261, 7279, 7297,
7333, 7369, 7442,</span></div><div><span style="font-size:
14px;"> 7460, 7478, 7534, 7645,
7683, 7701, 7739, 7834,
8065,</span></div><div><span style="font-size: 14px;">
8085, 8104, 8144, 8203, 8243, 8322,
8383, 8423, 8444,</span></div><div><span style="font-size:
14px;"> 8464, 8650, 8713, 8839,
8882, 8946, 8989, 9142,
9186,</span></div><div><span style="font-size: 14px;">
9341, 9409, 9432, 9454, 9477, 9500,
9523, 9754, 9801,</span></div><div><span style="font-size:
14px;"> 9872, 9968, 10040, 10138, 10187,
10336, 10512, 10720, 10800,</span></div><div><span style="font-size:
14px;"> 10907, 10934, 10988, 11015, 11070, 11407,
11465, 11581, 11640,</span></div><div><span style="font-size: 14px;">
11880, 11911, 11942, 12003, 12066, 12160, 12286, 12351,
12416,</span></div><div><span style="font-size: 14px;">
12754, 13112, 13611, 13814, 13980, 14421, 14607, 15094,
15352,</span></div><div><span style="font-size: 14px;">
15564, 15784, 15896, 16068, 16550])</span></div></div><div><span
style="font-size: 14px;"><br></span></div><div><span style="font-size: 14px;">#
Simple plot of the data. The third plot shows the "modulo 10k" of
the Webform data for comparison.</span></div><div><span style="font-size:
14px;"><br></span></div><div><div><span style="font-size: 14px;">fig, axes =
plt.subplots(nrows=1, ncols=3, figsize=(10, 5))</span></div><div><span
style="font-size: 14px;">axes[0].plot(z1)</span></div><div><span
style="font-size:
14px;">axes[0].set_title('UWYO-siphon')</span></div><div><span
style="font-size: 14px;">axes[1].plot(WebForm)</span></div><div><span
style="font-size:
14px;">axes[1].set_title('UWYO-WebForm')</span></div><div><span
style="font-size: 14px;">axes[2].plot(WebForm % 10000)</span></div><div><span
style="font-size: 14px;">axes[2].set_title('WebForm modulo
10k')</span></div><div><span style="font-size:
14px;">fig.tight_layout()</span></div></div><div><span style="font-size:
14px;"><br></span></div><div><div><div style="caret-color: rgb(0, 0, 0); color:
rgb(0, 0, 0);"><span style="font-size:
14px;">-------------------------------------------------------------------------------</span></div></div></div><div><span
style="font-size: 14px;"><br></span></div><div><span style="font-size:
14px;">Output:</span></div><div><span style="font-size:
14px;"><br></span></div><div><span style="font-size:
14px;"><br></span></div><div><img
src="cid:C5C4F92C-DF42-4F99-9FFB-814D36FEA577" style="box-sizing: unset;
max-width: 100%; height: auto; caret-color: rgb(0, 0, 0); color: rgb(0, 0, 0);
font-family: -apple-system, BlinkMacSystemFont, "Segoe UI",
Helvetica, Arial, sans-serif, "Apple Color Emoji", "Segoe UI
Emoji", "Segoe UI Symbol"; font-size: 14.000001px;"
alt="+P88Jbv7ya7TIAAAAAElFTkSuQmCC.png"></div><div><span style="font-size:
14px;"><br></span></div></body></html>