Hi Stuart-

Stuart Maclean wrote:
I am trying to produce imagery of bathy data using IDV's
Contour2DDisplayable.
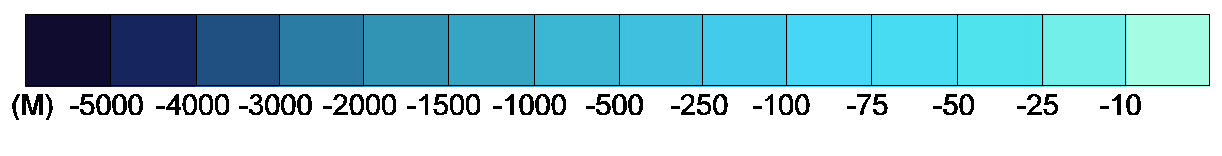
Please see the GEBO table at


http://www.ngdc.noaa.gov/mgg/image/IBCAO_GEBCO_comp_colortable_oc.jpg
I am trying to influence the Displayable so that my data is shown
according to the GEBCO scheme.
I am using
ContourLevels cl = new IrregularContourLevels( 0, 25, 50 .... 0 as per
the jpg)
displayable.setContourLevels( cl );

float[3][14] COLORS = rgbs for 14 colors as floats.

displayable.setColorPalette( COLORS );
It is not quite turning out as I expected. i suspect that the two
calls above are not as entwined as I had hoped. I note from the
javadoc the suggested use of setRangeForColor(). however is also
appears that the color palette is somehow linear in the scalar map
range?? The GEBCO scheme is not linear, but more discrete in its
binning.
The color table is a linear table.  At present, we don't support
using a Function (mapping of value to color), although
the underlying VisAD framework has support for this (not sure
if it has been tested).

At present, the only solution would be to generate a linear
table with enough levels to create the linear scale.
Any help gratefully appreciated.

Stuart

PS i hope i have not asked this before, i have trawled the logs...
Don
*************************************************************
Don Murray                               UCAR Unidata Program
dmurray@xxxxxxxxxxxxxxxx                        P.O. Box 3000
(303) 497-8628                              Boulder, CO 80307
http://www.unidata.ucar.edu/staff/donm
*************************************************************