Hi,
I have data sets where most values are very low with only a few but very
high peaks (up to 10^10).
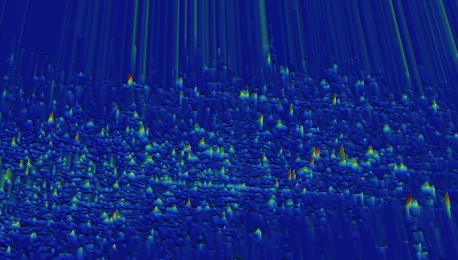
Sometimes it happens that in the 3D display the peaks do not seem to be
displayed according to their actual height but much lower. With the axes
scaled according to the max value this is obvious. The red peaks in the
attached screenshot should be several 1000 units high but they are
displayed only as high as 10 to 15.
What do I have to change for them to be displayed correctly?

Regards,
Julia Löcherbach