Arvind:

Using the TextAdapter in VisAD, you would make your file look like:
(x,y -> val)
x,y,val
10,15,.6
20,5,.8
5,10,.7
This says that your 'data object' is a mapping from a 2D domain (with
components called 'x' and 'y') to a single range component (called
'val'). The second line describes the ordering of these values in the
file, and then the data follows.
This little Python script:
from visad.python.JPythonMethods import *
import subs
a=load("arvind.txt")
dt = getDomainType(a)
rt = getRangeType(a)
maps = makeMaps(dt[0],'x', dt[1],'y', rt[0],'z')
disp=makeDisplay(maps)
maps[0].setRange(0,30)
maps[1].setRange(0,30)
d=getDomain(a)
for i in xrange(len(a)):
val = a[i][0].getValue()
x = d[i][0].getValue()
y = d[i][1].getValue()
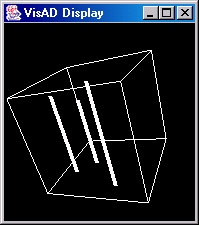
disp.drawLine( ((x,x),(y,y),(val,0.)), width=4)
disp.showDisplay()
Will produce the results in the attached image.
I hope this is a good starting point for you.
tom
--
Tom Whittaker (tomw@xxxxxxxxxxxxx)
University of Wisconsin-Madison
Space Science and Engineering Center
Cooperative Institute for Meteorological Satellite Studies
Phone/VoiceMail: 608.262.2759