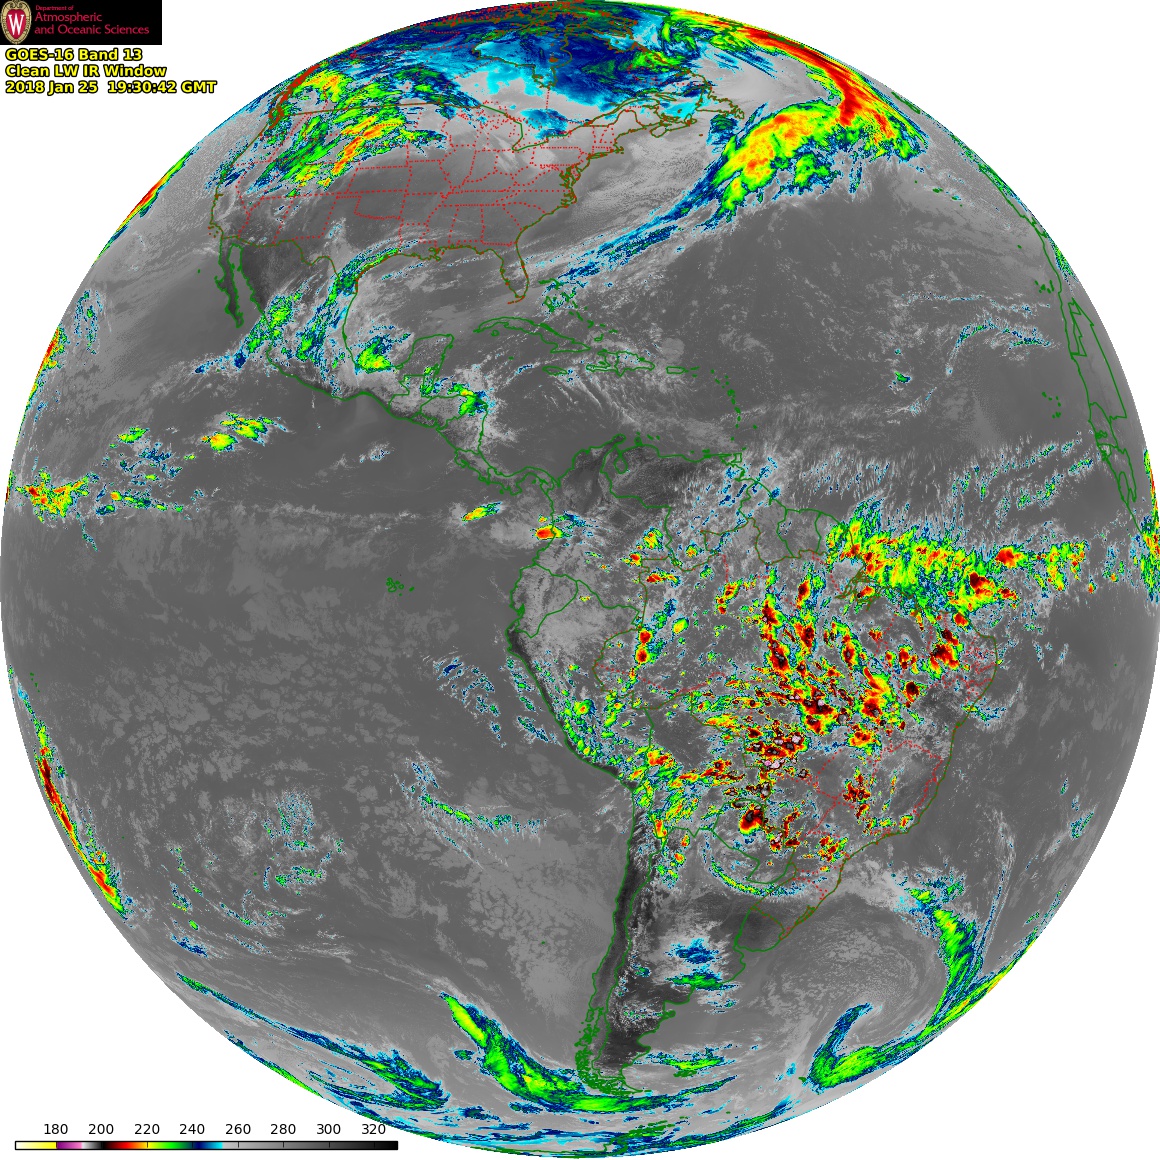
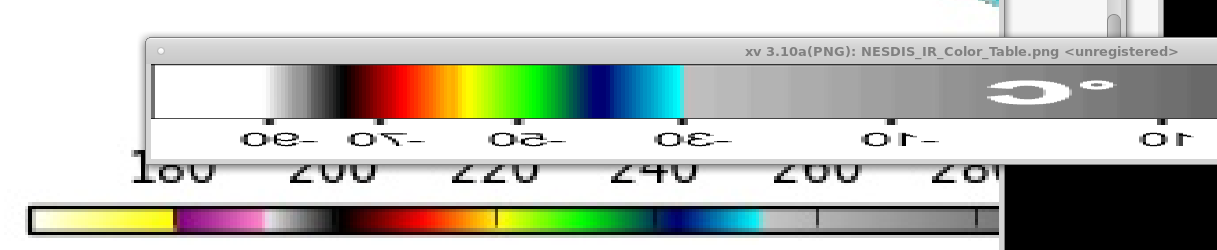
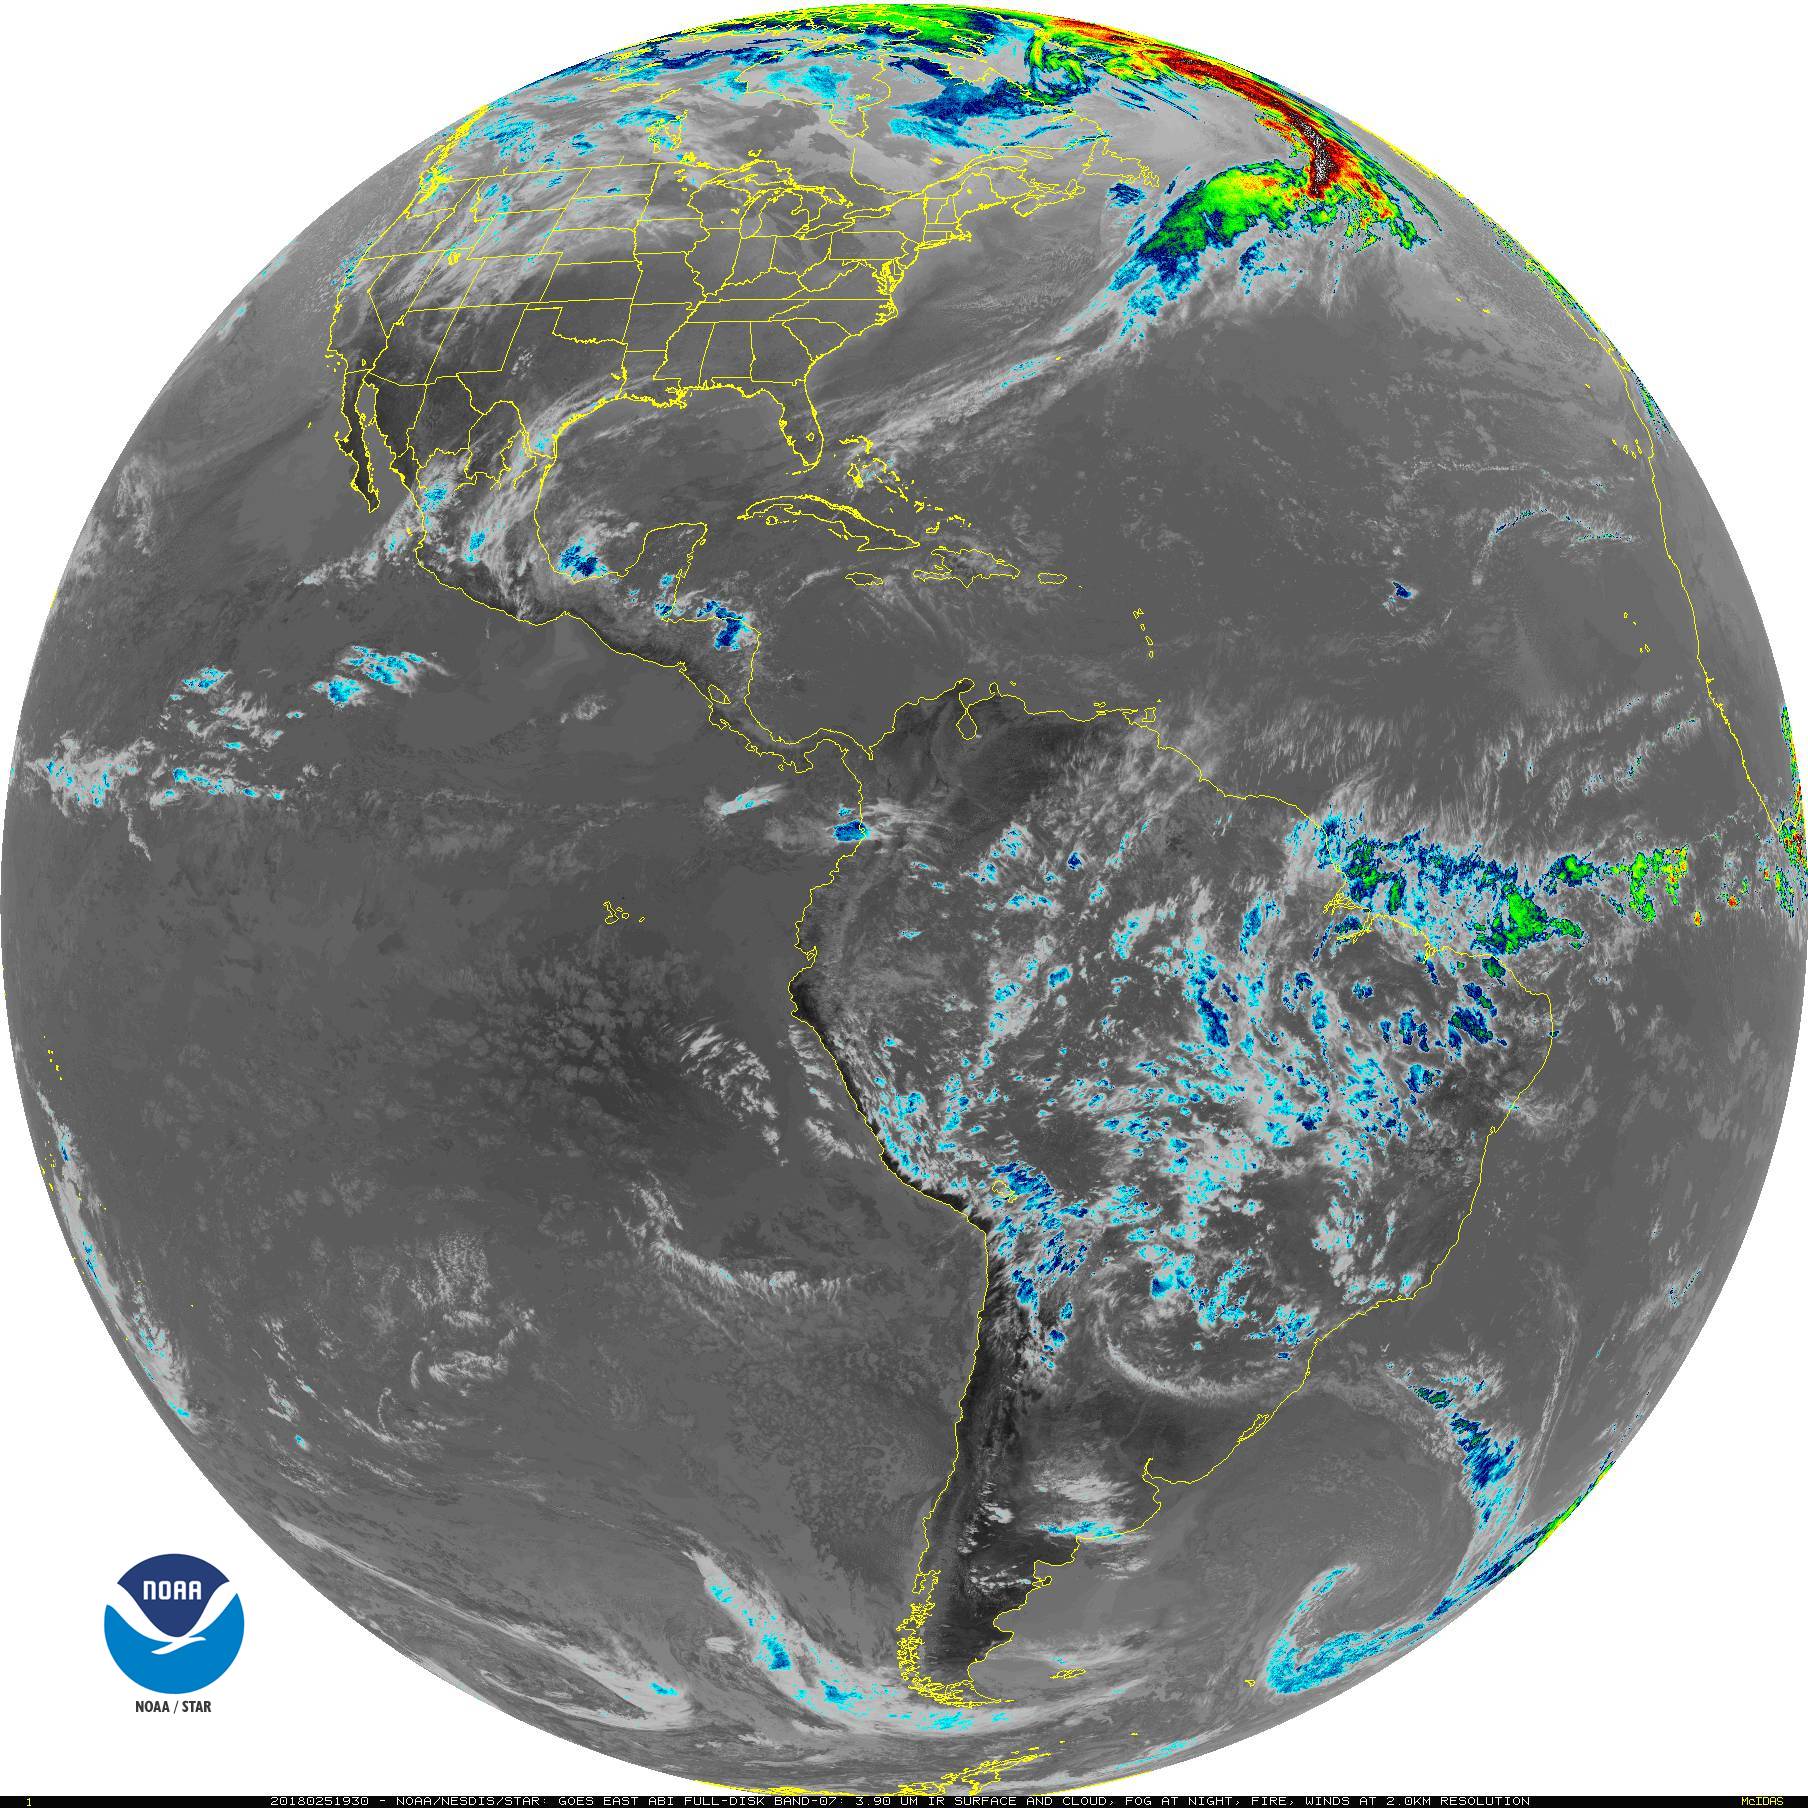
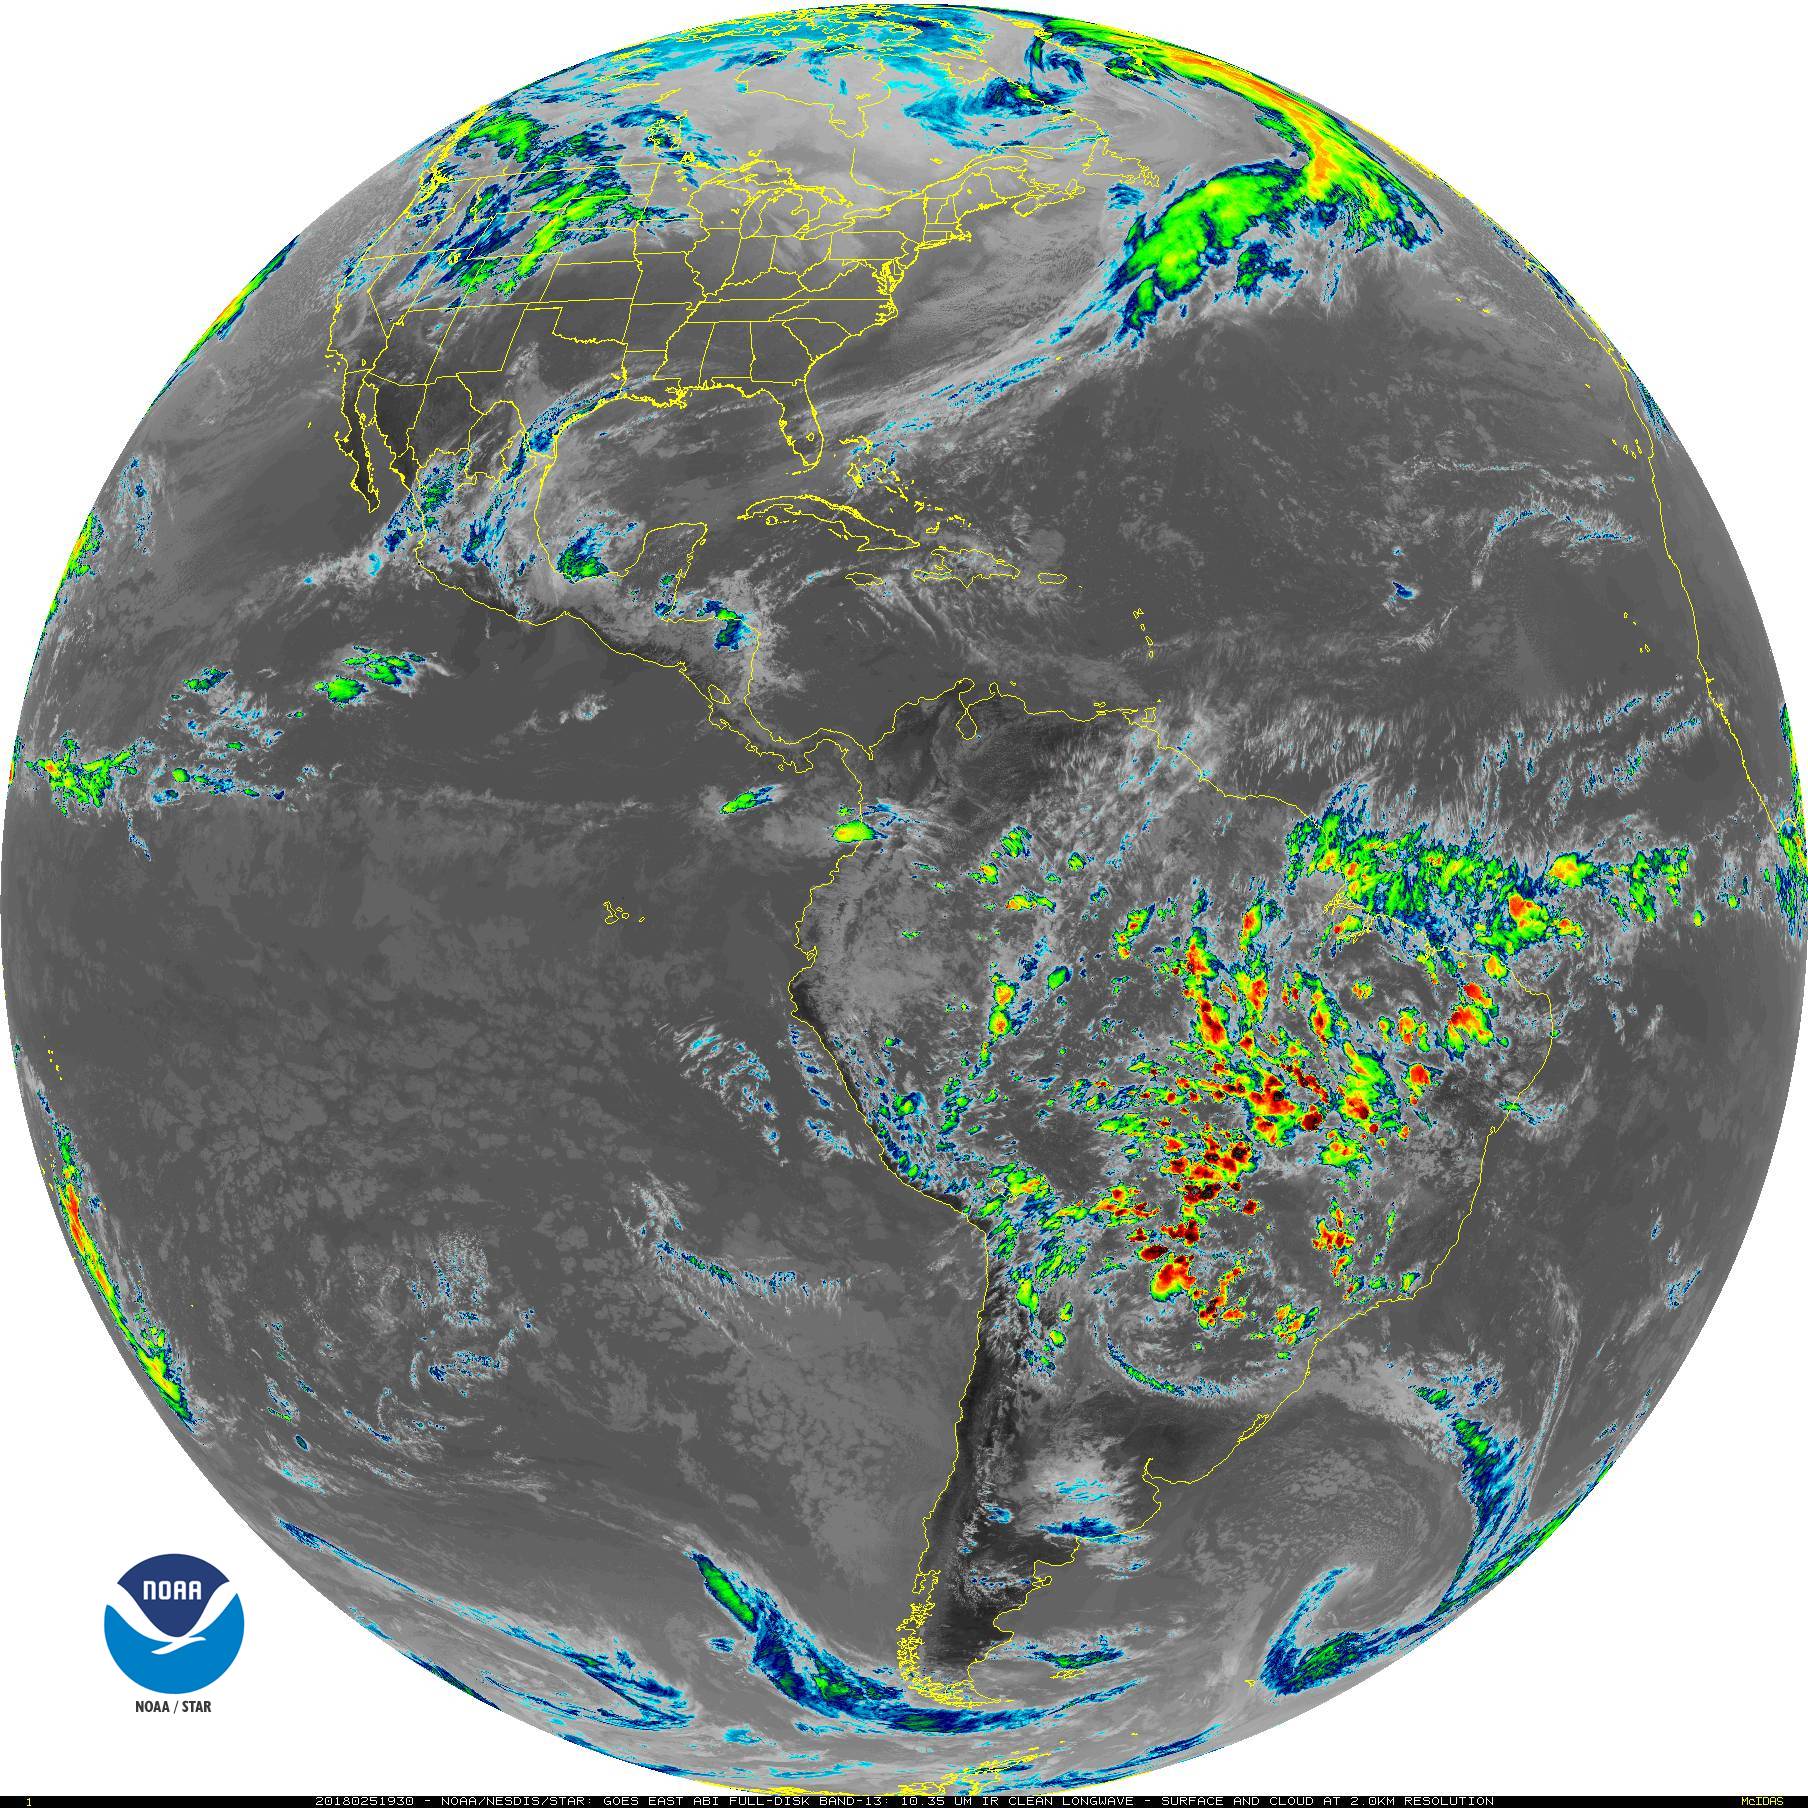
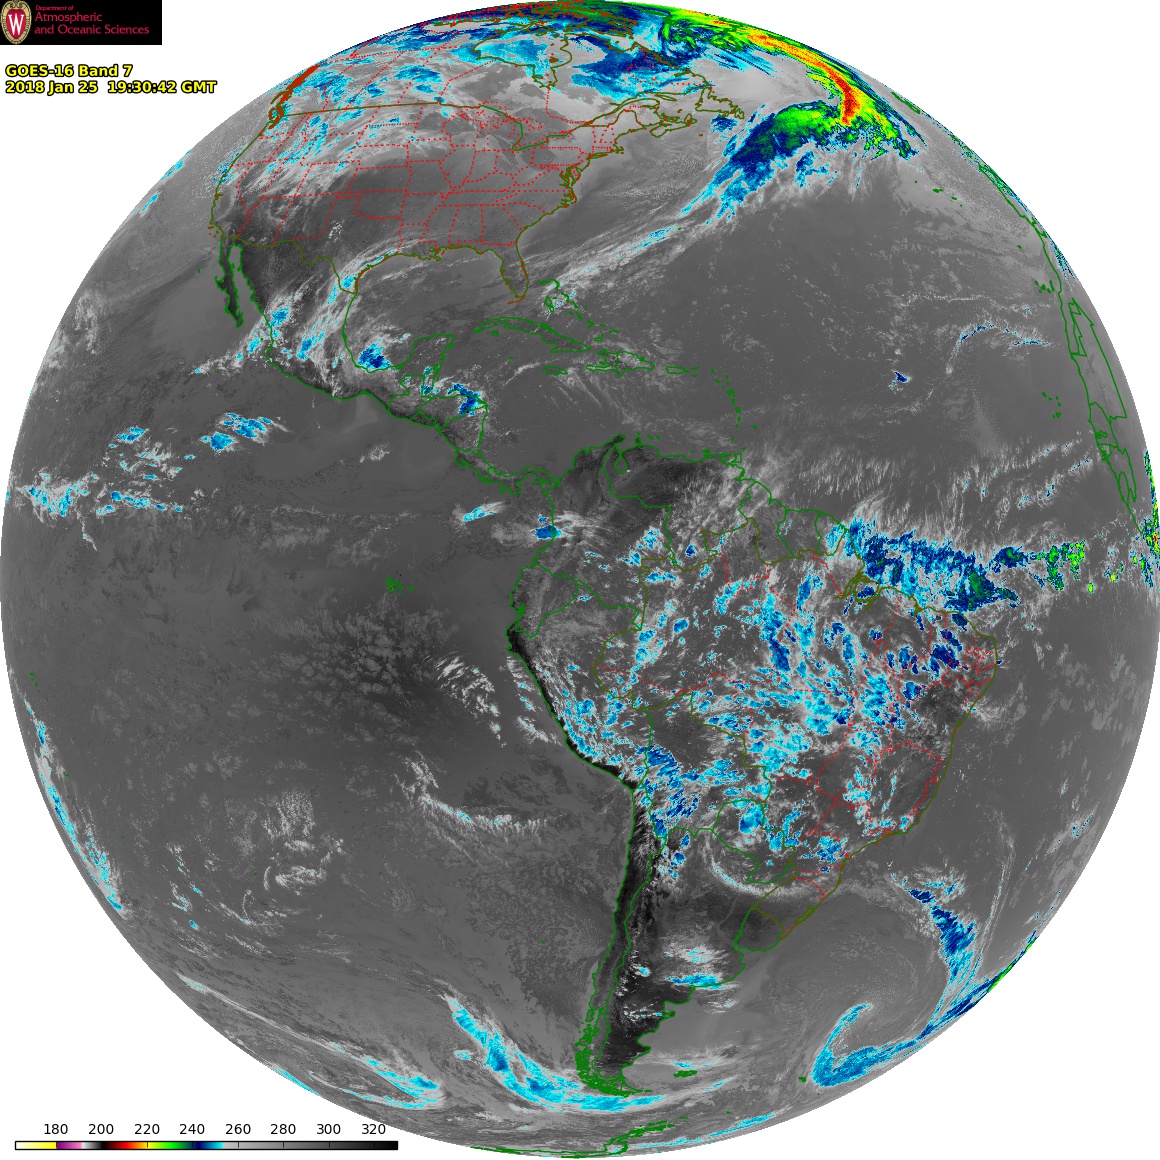
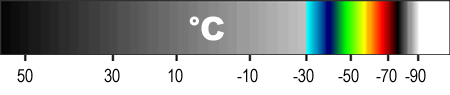
Art,


It's a little hard, since we are using slightly different color tables.


The NESDIS color table (attached) first uses color - cyan- at -30C (243K) and
then goes through a rainbow color table up to about -70C (203K) and then black
to white.


My color table, based on what I had seen CIMSS using, first uses cyan at 253K
(-20C) and cycles through colors up to about 203K (also -70C).


These same color tables are used for all of the IR images except the WV (so ABI
7 and 11-13)


I've attached copies of the NESDIS and UW-AOS versions of both channels 7 and
13,  all valid at 1930 UTC today, and the color table used by NESDIS since
theirs are not on the image like mine are - and also an image from last April
showing the IR color table that CIMSS used that I was trying to re[produce -
although now that I look, I think my purple should go to 183K, not 180. That
might be a bug for me, but only on the most cold temps.


A visual comparison of both of these - their ABI7 to mine, and their ABI13 to
mine - looks like we're the same, just using a different color scale..


I also attempted to overlay their color scale with mine so the temps lined up
(AOS_Color_Table_vs_NESDIS.png). The differences in our color scales would be
most evident at warmer temps - so maybe they are more prominent at ABI 7 which
is warmer than ABI 13 or 14, which are colder?


Thoughts?

Pete


<http://www.weather.com/tv/shows/wx-geeks/video/the-incredible-shrinking-cold-pool>--
Pete Pokrandt - Systems Programmer
UW-Madison Dept of Atmospheric and Oceanic Sciences
608-262-3086  - poker@xxxxxxxxxxxx


________________________________
From: Arthur A Person <aap1@xxxxxxx>
Sent: Thursday, January 25, 2018 8:04 AM
To: Pete Pokrandt
Cc: ldm-users
Subject: Re: [ldm-users] Problem calculating GOES-16 brightness temperature
from radiance

Pete,

No, I didn't.  With your plots, I just did some more checking...  Approximating
your curve, I got similar results
using GRB data from amazon.  However, when I switch back to approximating the
curve on
https://www.star.nesdis.noaa.gov/GOES/GOES16_FullDisk_Band.php?band=07&length=24
and plotting, my image again appears warmer.  How do your plots compare to
what's on the star site?

Thanks...          Art


________________________________
From: "Pete Pokrandt" <poker@xxxxxxxxxxxx>
To: "ARTHUR AUGUST PERSON" <aap1@xxxxxxx>
Cc: "ldm-users" <ldm-users@xxxxxxxxxxxxxxxx>
Sent: Wednesday, January 24, 2018 10:48:46 PM
Subject: Re: [ldm-users] Problem calculating GOES-16 brightness temperature
from        radiance

Art,


Did you ever get this figured out? I plotted up an ABI full disk image from the
GRB Radiance data coming in from both the Unidata DIFAX feed and from the tiled
NOAAPORT CMI data. They seem pretty much the same to me, considering resolution
differences - 2km for GRB vs 6km for the NOAAPORT data.


GRB image -
http://whirlwind.aos.wisc.edu/~wxp/goes16/test/201801210430_fulldisk_grb.jpg


NOAAPORT image -
http://whirlwind.aos.wisc.edu/~wxp/goes16/test/201801210430_fulldisk.jpg


Pete


<http://www.weather.com/tv/shows/wx-geeks/video/the-incredible-shrinking-cold-pool>--
Pete Pokrandt - Systems Programmer
UW-Madison Dept of Atmospheric and Oceanic Sciences
608-262-3086  - poker@xxxxxxxxxxxx


________________________________
From: ldm-users-bounces@xxxxxxxxxxxxxxxx <ldm-users-bounces@xxxxxxxxxxxxxxxx>
on behalf of Arthur A Person <aap1@xxxxxxx>
Sent: Monday, January 15, 2018 4:45 PM
To: ldm-users
Subject: Re: [ldm-users] Problem calculating GOES-16 brightness temperature
from radiance

All --

I'm starting to think there may be a problem with the GOES-16 channel 7 GRB
NetCDF data.  I wrote a short test code
(included below) that calculates brightness temperature and produces a png file
with an abbreviated color table for comparison
with the NESDIS https://www.star.nesdis.noaa.gov/GOES/GOES16_CONUS.php imagery.
 When using the channel 7 data,
the calculated imagery appears noticeably warmer, but when using channel 14
data (for example), the images appear
very close in value.

Would someone else mind taking a look at this and confirm whether this might be
the case, or whether I'm just losing my mind?

Thanks!
                      Art

_________________________________________________________________________________________________________

from netCDF4 import Dataset
import numpy as np
import matplotlib.pyplot as plt
from matplotlib.colors import LinearSegmentedColormap

filename =
"amazon/OR_ABI-L1b-RadC-M3C07_G16_s20180151547235_e20180151550019_c20180151550058.nc"
#filename =
"amazon/OR_ABI-L1b-RadC-M3C14_G16_s20180151547235_e20180151550008_c20180151550050.nc"

dataset = Dataset(filename,'r')

# Get coefficients for calculation of brightness temperature
planck_fk1 = dataset.variables['planck_fk1'][:]
planck_fk2 = dataset.variables['planck_fk2'][:]
planck_bc1 = dataset.variables['planck_bc1'][:]
planck_bc2 = dataset.variables['planck_bc2'][:]
print("planck_fk1: ",planck_fk1)
print("planck_fk2: ",planck_fk2)
print("planck_bc1: ",planck_bc1)
print("planck_bc2: ",planck_bc2)

# Read the radiance data
rad = dataset.variables['Rad'][:]

dataset.close()

# Calculate brightness temperature
bt = ( (planck_fk2 / (np.log( (planck_fk1/rad)+1 ))) - planck_bc1 ) / planck_bc2
bt = bt - 273.15

# Create a color table to compare against
https://www.star.nesdis.noaa.gov/GOES/GOES16_CONUS.php imagery
red = []
green = []
blue = []
valmin=-110.
valmax=55.
red.append( [0.0, 0.0, 0.0] )
green.append( [0.0, 0.0, 0.0] )
blue.append( [0.0, 0.0, 0.0] )
red.append( [ (-50.0-valmin)/(valmax-valmin), 0.0, 0.0 ] )
green.append( [ (-50.0-valmin)/(valmax-valmin), 1.0, 1.0 ] )
blue.append( [ (-50.0-valmin)/(valmax-valmin), 0.0, 0.0 ] )
red.append( [ (-40.0-valmin)/(valmax-valmin), 0.0, 0.0 ] )
green.append( [ (-40.0-valmin)/(valmax-valmin), 0.0, 0.0 ] )
blue.append( [ (-40.0-valmin)/(valmax-valmin), 0.4, 0.4 ] )
red.append( [ (-30.0-valmin)/(valmax-valmin), 0.0, 0.8 ] )
green.append( [ (-30.0-valmin)/(valmax-valmin), 1.0, 0.8 ] )
blue.append( [ (-30.0-valmin)/(valmax-valmin), 1.0, 0.8 ] )
red.append( [ 1.0, 0.0, 0.0 ] )
green.append( [ 1.0, 0.0, 0.0 ] )
blue.append( [ 1.0, 0.0, 0.0 ] )
cdict = {'red': red, 'green': green, 'blue': blue}
ctbl = LinearSegmentedColormap('custom', cdict)

# Set the figure size
fig = plt.figure(1, figsize=(23, 15))

# Display the image
im = plt.imshow(bt, cmap=ctbl, vmin=valmin, vmax=valmax )

# Display a color bar
cb = plt.colorbar( orientation='vertical', shrink=0.7, pad=0.01, aspect=30 )
cb.set_label("Brightness Temperature (C)")

# Save the image to a png file
plt.savefig('plot.png', dpi=100)


________________________________
From: "Pete Pokrandt" <poker@xxxxxxxxxxxx>
To: "ARTHUR AUGUST PERSON" <aap1@xxxxxxx>
Cc: "ldm-users" <ldm-users@xxxxxxxxxxxxxxxx>
Sent: Saturday, January 13, 2018 9:03:11 PM
Subject: Re: [ldm-users] Problem calculating GOES-16 brightness temperature
from        radiance

Forgot to cc to the list.

Here's a commented version of the script that I'm currently using to plot ABI
channel 13 (clear channel IR window) but the calculation for BT should work for
any of the channels 7-16.

I am using just the radiance values read in from the netcdf files, without
applying any scale/offset to them. Perhaps the netcdf4 read does that for us? I
am reading the scale and offset info in for reference, and printing them out,
but I am not using them in my calculations at all.

If for some reason, the attachment doesn't come through, you can get the file at

http://sysadm.aos.wisc.edu/~poker/goes16_GRB_fulldisk_IR13_ircm.py

Hope this helps,
Pete


<http://www.weather.com/tv/shows/wx-geeks/video/the-incredible-shrinking-cold-pool>--
Pete Pokrandt - Systems Programmer
UW-Madison Dept of Atmospheric and Oceanic Sciences
608-262-3086  - poker@xxxxxxxxxxxx


________________________________
From: Arthur A Person <aap1@xxxxxxx>
Sent: Saturday, January 13, 2018 9:04 AM
To: Pete Pokrandt
Cc: ldm-users
Subject: Re: [ldm-users] Problem calculating GOES-16 brightness temperature
from radiance

Pete,

Thanks for the help.  Actually, I already tried adding parens to the equation,
including the variation you
suggested, but the results are the same.  Do you have a few lines of code that
worked for you that you'd
be willing to share?  Or, do you recall whether there's any issue with netCDF
auto-scaling the input data,
or any units conversion that has to be included that's not in the documentation?

Thanks...       Art


________________________________
From: "Pete Pokrandt" <poker@xxxxxxxxxxxx>
To: "ARTHUR AUGUST PERSON" <aap1@xxxxxxx>, "ldm-users"
<ldm-users@xxxxxxxxxxxxxxxx>
Sent: Friday, January 12, 2018 11:47:08 AM
Subject: Re: [ldm-users] Problem calculating GOES-16 brightness temperature
from        radiance

Art,


I think it may be a parenthesis/order of operations issue. I seem to recall
having this same issue when I first started working with the GRB data.

Try this:


bt = ( planck_fk2 / ( np.log((planck_fk1 / rad) + 1 )) - planck_bc1) /
planck_bc2


Pete


________________________________
From: ldm-users-bounces@xxxxxxxxxxxxxxxx <ldm-users-bounces@xxxxxxxxxxxxxxxx>
on behalf of Arthur A Person <aap1@xxxxxxx>
Sent: Friday, January 12, 2018 7:43 AM
To: ldm-users@xxxxxxxxxxxxxxxx
Subject: [ldm-users] Problem calculating GOES-16 brightness temperature from
radiance

Hi...

I'm trying to calculate brightness temperature from radiance for GOES-16 IR
channel 7 using rebroadcast data
but my values compared to McIDAS imagery are coming out 15 to 20 degrees C too
warm.  I'm using the following
values and code:

Test imagery:
OR_ABI-L1b-RadC-M3C07_G16_s20180112232223_e20180112235008_c20180112235045.nc

rad (radiance) is read in from and auto-scaled by netCDF,
planck_fk1:  202263.0
planck_fk2:  3698.18994140625
planck_bc1:  0.4336099922657013
planck_bc2:  0.9993900060653687

bt = ( planck_fk2 / np.log( (planck_fk1/rad)+1 ) - planck_bc1 ) / planck_bc2
bt = bt - 273.15

Can anyone tell me if I'm missing a step or spot a dumb mistake?

Thanks...       Art

--
Arthur A. Person
Assistant Research Professor, System Administrator
Penn State Department of Meteorology and Atmospheric Science
email:  aap1@xxxxxxx, phone:  814-863-1563


--
Arthur A. Person
Assistant Research Professor, System Administrator
Penn State Department of Meteorology and Atmospheric Science
email:  aap1@xxxxxxx, phone:  814-863-1563


--
Arthur A. Person
Assistant Research Professor, System Administrator
Penn State Department of Meteorology and Atmospheric Science
email:  aap1@xxxxxxx, phone:  814-863-1563


--
Arthur A. Person
Assistant Research Professor, System Administrator
Penn State Department of Meteorology and Atmospheric Science
email:  aap1@xxxxxxx, phone:  814-863-1563
Attachment:
ABI13-UW-AOS-20180125_1930.jpg
Description: ABI13-UW-AOS-20180125_1930.jpg
Attachment:
AOS_Color_Table_vs_NESDIS.png
Description: AOS_Color_Table_vs_NESDIS.png
Attachment:
CIMSS_IR_Color_Table_example.GIF
Description: CIMSS_IR_Color_Table_example.GIF
Attachment:
ABI07-NESDIS-20180125_1930.jpg
Description: ABI07-NESDIS-20180125_1930.jpg
Attachment:
ABI13-NESDIS-20180125_1930.jpg
Description: ABI13-NESDIS-20180125_1930.jpg
Attachment:
ABI07-UW-AOS-20180125_1930.jpg
Description: ABI07-UW-AOS-20180125_1930.jpg
Attachment:
NESDIS_IR_Color_Table.png
Description: NESDIS_IR_Color_Table.png
ldm-users archives: