On 12/10/2016 08:13 PM, Patrick L. Francis wrote:
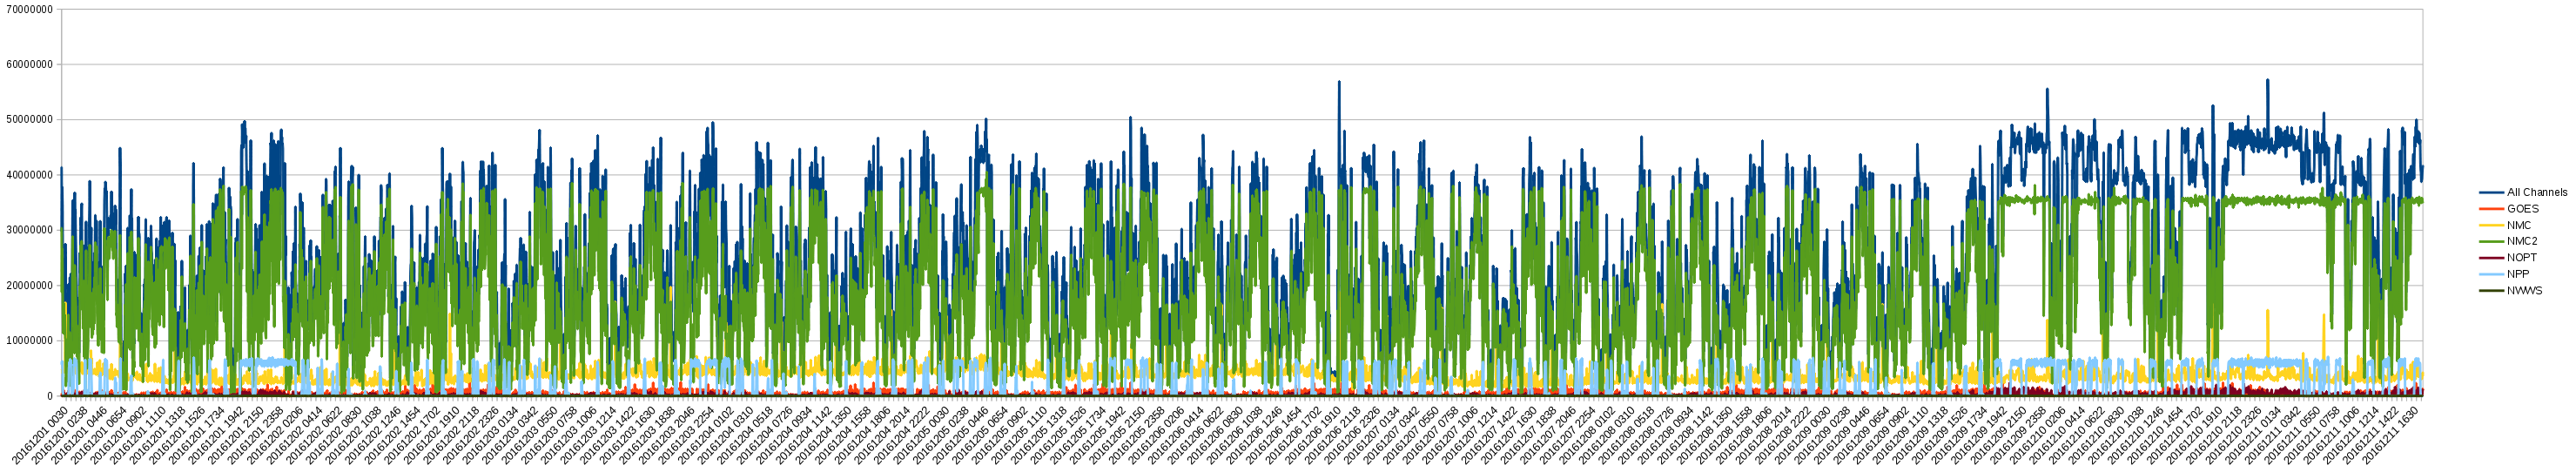
Something is definitely different with noaaport data volume... earlier I
showed where we seemed to have reach some maximum, and after rebooting
everything and cleaning up the involved hardware, we still seem to be
running hotter than normal... here is the latest daily chart (plots at 5
min average intervals)

http://modelweather.com/files/noaaport/2016.12.10.noaaport.day.png

and then we compare the daily chart to weekly charts, we can see
'something' happened recently to dramatically change volumes.

http://modelweather.com/files/noaaport/2016.12.10.noaaport.week.png

cheers,

--patrick


…………………………………………………………...........

Patrick L. Francis

Vice President of Research & Development

Aeris Weather


http://aerisweather.com/

http://modelweather.com/


wxprofessor@xxxxxxxxx <mailto:wxprofessor@xxxxxxxxx>

http://facebook.com/wxprofessor/


…………………………………………………………


..


------ Original Message ------
From: "Patrick L. Francis" <wxprofessor@xxxxxxxxx
<mailto:wxprofessor@xxxxxxxxx>>
To: "nws.noaaport.support@xxxxxxxx" <NWS.NOAAPORT.SUPPORT@xxxxxxxx
<mailto:NWS.NOAAPORT.SUPPORT@xxxxxxxx>>; "NOAAPORT"
<noaaport@xxxxxxxxxxxxxxxx <mailto:noaaport@xxxxxxxxxxxxxxxx>>; "LDM"
<ldm-users@xxxxxxxxxxxxxxxx <mailto:ldm-users@xxxxxxxxxxxxxxxx>>
Sent: 12/10/2016 5:40:35 PM
Subject: noaaport volume maxima
HRRR over noaaport is having distribution issues again... notice here beginning wih 21z file sizes show as incomplete: http://modelweather.com/files/noaaport/noaaport.hrrr.2016.12.10.png Another interesting factor is that over the last few days, noaaport volume has 'flatlines' near 50mb which is indicative that perhaps a maxima in volume has been reached during peak times? notice in the following chart: http://modelweather.com/files/noaaport/noaaport.volume.2016.12.10.png that 50M maximas are reached with that one teenie peak of about 55M ... when reading the chart 'new' is on the right 'old' left, and 'down' means incoming data volumes... both of my dishes run incoming from noaaport (novra) on a dedicated nic to ensure proper volume analysis... if anyone else notices their HRRR having problems around 21z.. please let me know.. I'm trying to write some workarounds to accomodate for old data :/ Cheers, --patrick …………………………………………………………........... Patrick L. Francis Vice President of Research & Development Aeris Weather http://aerisweather.com/ http://modelweather.com/ wxprofessor@xxxxxxxxx <mailto:wxprofessor@xxxxxxxxx> http://facebook.com/wxprofessor/ ………………………………………………………… .._______________________________________________ NOTE: All exchanges posted to Unidata maintained email lists are recorded in the Unidata inquiry tracking system and made publicly available through the web. Users who post to any of the lists we maintain are reminded to remove any personal information that they do not want to be made public. ldm-users mailing list ldm-users@xxxxxxxxxxxxxxxx For list information or to unsubscribe, visit: http://www.unidata.ucar.edu/mailing_lists/
Attachment:
201612BandwidthAnalysis.png
Description: PNG image
ldm-users archives: