Fellow LDMers,

For some time, I've been monitoring our ldm(s) (on several machines) by
plotting the 5-min loads in the metrics log and putting them on a web page I
could check periodically..  Sometime overnight, on each of the machines,
something strange happened.  Rather than adding to the existing log file, each
time the ldmadmin addmetrics command is executed by cron, a new metrics file is
created.  Here's what I'm seeing in the log directory now:

[ldm@idd ~]$ ls -l logs
total 16
-rw-r--r--. 1 ldm apps   0 Aug 24  2014 ldmd.log
-rw-r--r--. 1 ldm apps   0 Aug 23  2014 ldm-mcidas.log
-rw-r--r--. 1 ldm apps   0 Jun  7 10:36 metrics.txt
-rw-r--r--. 1 ldm apps 112 Jun  7 10:35 metrics.txt.1
-rw-r--r--. 1 ldm apps 111 Jun  7 10:30 metrics.txt.2
-rw-r--r--. 1 ldm apps 112 Jun  7 10:25 metrics.txt.3
-rw-r--r--. 1 ldm apps 110 Jun  7 10:20 metrics.txt.4

And here's the crontab for user ldm on that machine:

[ldm@idd ~]$ crontab -l
#
# Monitor system performance
#
*/5 * * * * bin/ldmadmin addmetrics
*/5 * * * * ./plot_load.sh &> /dev/null
#
# New metrics file every week
* * * * 0 bin/ldmadmin newmetrics

and here's the ldm registry:

[ldm@idd ~]$ regutil
/delete-info-files : 0
/hostname : idd.unl.edu
/insertion-check-interval : 300
/reconciliation-mode : do nothing
/check-time/enabled : 1
/check-time/limit : 10
/check-time/warn-if-disabled : 1
/check-time/ntpdate/command : /usr/sbin/ntpdate
/check-time/ntpdate/servers : ntp.ucsd.edu ntp1.cs.wisc.edu ntppub.tamu.edu
otc1.psu.edu timeserver.unidata.ucar.edu
/check-time/ntpdate/timeout : 5
/metrics/count : 4
/metrics/file : /usr/local/ldm/logs/metrics.txt
/metrics/files : /usr/local/ldm/logs/metrics.txt*
/metrics/netstat-command : /bin/netstat -A inet -t -n
/metrics/top-command : /usr/bin/top -b -n 1
/log/count : 7
/log/file : /usr/local/ldm/var/logs/ldmd.log
/log/rotate : 1
/pqsurf/config-path : /usr/local/ldm/etc/pqsurf.conf
/pqsurf/datadir-path : /usr/local/ldm/var/data
/scour/config-path : /usr/local/ldm/etc/scour.conf
/surf-queue/path : /usr/local/ldm/var/queues/pqsurf.pq
/surf-queue/size : 2000000
/server/config-path : /usr/local/ldm/etc/ldmd.conf
/server/ip-addr : 0.0.0.0
/server/max-clients : 256
/server/max-latency : 3600
/server/port : 388
/server/time-offset : 3600
/queue/path : /usr/local/ldm/var/queues/ldm.pq
/queue/size : 4G
/queue/slots : default
/pqact/config-path : /usr/local/ldm/etc/pqact.conf
/pqact/datadir-path : /usr/local/ldm/var/data

If I run ldmadmin addmetrics manually, it appends to the logs/metrics.txt file
normally.

Has anyone else every experienced this type of behavior?  As I said, it
occurred on more than one machine (6, to be exact) overnight; some running
CentOS 6, some running CentOS 7..  It had been working fine for months up until
today. I've attached a sample plot from one of the machines.

Thanks,
Clint

====================================================================
Clinton M. Rowe
Professor and Graduate Chair                     phone:(402)472-1946
Earth & Atmospheric Sciences                       fax:(402)472-4917
University of Nebraska- Lincoln
crowe1@xxxxxxx<mailto:crowe1@xxxxxxx>
Attachment:
idd_load.png
Description: idd_load.png
ldm-users archives: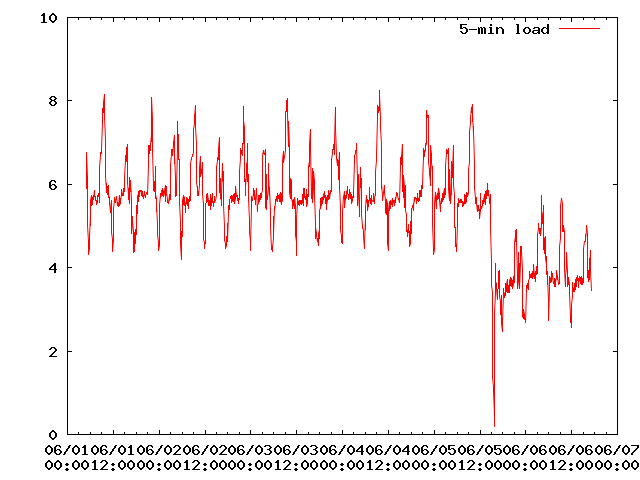