Alt-Right Mouse Button gives a readout of all values at the cursor position .
The middle mouse button (scroll wheel) does the same, but also causes
my display to rotate vertically (on Mac) or zoom out (on PC). (??)
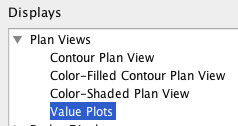
To see numbers everywhere all over the map, you could use a Value Plots display,
but that isn't what you meant I suppose.
[cid:DB99D595-3BE0-4B1F-A1A0-C2BF70DBC13A@attlocal.net]
Brian Mapes
On Dec 2, 2014, at 8:25 AM, Alejandro Villamarin wrote:
Hello everyone,
Please forgive me if I ask something really obvious, but I've been looking
everywhere in IDV and in the User Manual and I can't find an answer.
I'm trying to show the grid point in the display generated for a particular
variable from a netCDF file I have that contains weather forecast data. Is
this possible? If so....how?
Thanks!
Alejandro
_______________________________________________
idvusers mailing list
idvusers@xxxxxxxxxxxxxxxx<mailto:idvusers@xxxxxxxxxxxxxxxx>
For list information, to unsubscribe, visit:
http://www.unidata.ucar.edu/mailing_lists/
Brian Mapes
bmapes@xxxxxxxxxxxxxxx<mailto:bmapes@xxxxxxxxxxxxxxx>