Sorry, I messed up the capture.  Correction attached....

tom


On Sun, Apr 20, 2008 at 2:51 PM, Tom Whittaker <whittaker@xxxxxxxx> wrote:
> Hi Dan --
>
>  I assume from your description that you tried to do a "change range"
>  on the theta-e plot.  In my example, the original range was
>  250-420K.....so perhaps you just tried changing the range to something
>  like 310-420K or something?
>
>  The behaviour of this is that it then treats all values from 250-309
>  as if there were equal to 310, for the purpose of mapping from the
>  data to the color table.
>
>  The way I know of to accomplish this is to edit the color table, click
>  on the "Transparency" radio button, set the transparency to 100%, and
>  then grab the slider above the "250" and drag it to the right (you
>  should see black/white checkboard pattern).  You will then get
>  something like the attached (I hope) image.
>
>  Hope that helps...
>
>  tom
>
>
>
>  On Sun, Apr 20, 2008 at 12:42 PM, Dan Grey <dangrey@xxxxxxxxx> wrote:
>  > I've got a sat pic (from a server under "Images") on the surface, and
>  >  a colour-shaded plot of theta-e at 850 hPa from the GFS above. I
>  >  restrict the visible range of the theta-e to a value so only areas
>  >  above a certain value are shown (to illustrate a plume event). However
>  >  areas with theta-e below my range appear black, rather than showing
>  >  through the sat pic below.
>  >
>  >  Am I missing something simple, is this is intended behaviour, or is it a
> bug?
>  >
>  >
>  >  Dan
>  >  _______________________________________________
>  >  idvusers mailing list
>  >  idvusers@xxxxxxxxxxxxxxxx
>  >  For list information, to unsubscribe, visit:
> http://www.unidata.ucar.edu/mailing_lists/
>  >
>
>
>
>  --
>  Tom Whittaker
>  University of Wisconsin-Madison
>  Space Science & Engineering Center (SSEC)
>  Cooperative Institute for Meteorological Satellite Studies (CIMSS)
>  1225 W. Dayton Street
>  Madison, WI 53706 USA
>  ph: +1 608 262 2759
>


--
Tom Whittaker
University of Wisconsin-Madison
Space Science & Engineering Center (SSEC)
Cooperative Institute for Meteorological Satellite Studies (CIMSS)
1225 W. Dayton Street
Madison, WI 53706 USA
ph: +1 608 262 2759
Attachment:
thetae.jpg
Description: JPEG image
idvusers archives: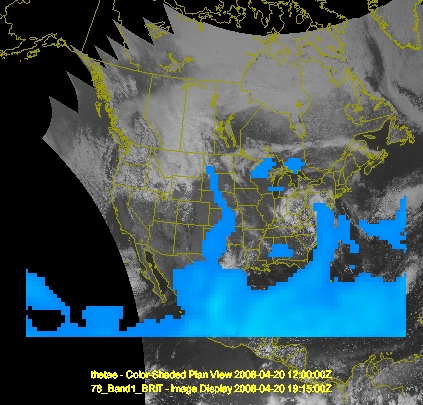