Anne,
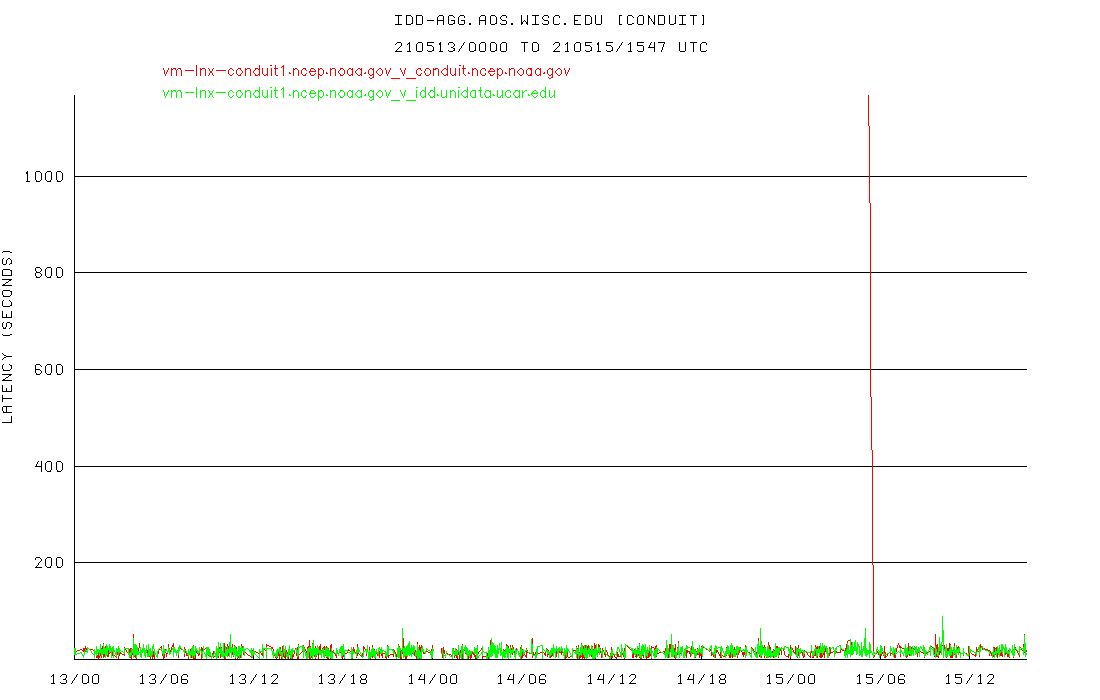
Over the past few days, our latencies have been in line with what we have come
to expect - 30-60 seconds as the bursts of model forecast hours come through.
Here's the graph of our latencies the past ~3 days. That red blip around 15/06
looks like maybe a conduit ingest server's ldm was restarted? Other than that,
they are pretty consistently 30-60s. This graph can be found at
https://rtstats.unidata.ucar.edu/cgi-bin/rtstats/iddstats_nc?CONDUIT+idd-agg.aos.wisc.edu
Pete
[cid:9377ebe1-5745-4dd7-bec0-98a991b681d2]
<http://www.weather.com/tv/shows/wx-geeks/video/the-incredible-shrinking-cold-pool>-----
Pete Pokrandt - Systems Programmer
UW-Madison Dept of Atmospheric and Oceanic Sciences
608-262-3086 - poker@xxxxxxxxxxxx
________________________________
From: conduit <conduit-bounces@xxxxxxxxxxxxxxxx> on behalf of Anne Myckow -
NOAA Federal via conduit <conduit@xxxxxxxxxxxxxxxx>
Sent: Tuesday, May 11, 2021 2:57 PM
To: support-conduit@xxxxxxxxxxxxxxxx <conduit@xxxxxxxxxxxxxxxx>
Subject: [conduit] Recent CONDUIT latencies?
CONDUIT users,
Can you let us know what your latencies have been recently? We have had
customers complaining about transfer rates on some of our systems and I want to
see if it might be affecting you as well.
Thanks,
Anne
--
Anne Myckow
Dataflow Team Lead
NWS/NCEP/NCO