Edward E. Hindman, Stanley D. Gedzelman and Kwan-Yin Kong
Earth and Atmospheric Sciences Department
The City College of New York, New York
City, New York 10031 USA
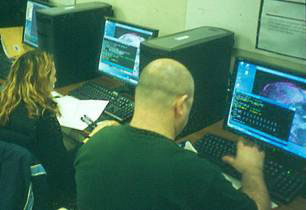
Our students learn the basic principles governing the atmosphere, solid earth and the oceans and their applications through a Earth Systems Science curriculum. The use of computers is an integral part of this education. Consequently, we have developed a computer laboratory to use in our teaching and research. The laboratory has been developed over the past 15 years with initial funds from the Unidata Program as well as research funds from NSF, ONR, NASA and NOAA and support from The City College. In 2003, we obtained Unidata support to replace seven aging computers in the laboratory.
The laboratory consists of personal computers (PCs) running Windows 98 and XP. A Unix host runs McIDAS XCD and the PCs use Hummingbird Exceed to connect to the host. Thus, students using the PCs can switch between either the Unix or Windows environments. The PCs have software for Internet access, word processing and numerical analyses, as well as image analysis and geographic information systems software. A PC and LCD projector are used in a nearby classroom to display information from the laboratory to enhance student learning.
 The laboratory is central to the Department's required junior level course
Global Modeling and Data Bases (www.sci.ccny.cuny.edu/~hindman/EAS308)
as well as a showpiece of the Science Division. Students in the course utilize
the laboratory to collect, analyze and interpret remotely sensed data as individual
class projects. For example, one student successfully compared the diurnal skin
temperature of the Earth's surface with nearby meteorological measurements.
The skin temperature was determined from GOES images using standard McIDAS techniques.
The images and corresponding meteorological data were downloaded from the Unidata
archives at the University of Wisconsin. Another student successfully conducted
a similar study using sea-surface-temperatures and adjacent buoy data
The laboratory is central to the Department's required junior level course
Global Modeling and Data Bases (www.sci.ccny.cuny.edu/~hindman/EAS308)
as well as a showpiece of the Science Division. Students in the course utilize
the laboratory to collect, analyze and interpret remotely sensed data as individual
class projects. For example, one student successfully compared the diurnal skin
temperature of the Earth's surface with nearby meteorological measurements.
The skin temperature was determined from GOES images using standard McIDAS techniques.
The images and corresponding meteorological data were downloaded from the Unidata
archives at the University of Wisconsin. Another student successfully conducted
a similar study using sea-surface-temperatures and adjacent buoy data
 The Science Division's required sophomore-level course Measurements, Modeling
and Computing also uses the computer laboratory. One exercise, creating
Global Modeling and Data Bases, also uses the computer laboratory.
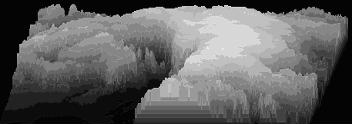
Another excercise is creating 3-D views of infrared satellite images from McIDAS
using the Visual Basic (VB) language. Three-dimensional views are extremely
useful in displaying storm anatomy. Students download grid-point files in ASCII
format of temperatures from infrared satellite images of interesting weather
situations from McIDAS. They then run a VB program that ceates an oblique 3-D
view of the situation in which height is linearly related to temperature. Using
this procedure, students produced the 3-D (right) view of a deeply occluded
mid-latitude cyclone that occurred over the eastern USA on 11 February 1998.
The Science Division's required sophomore-level course Measurements, Modeling
and Computing also uses the computer laboratory. One exercise, creating
Global Modeling and Data Bases, also uses the computer laboratory.
Another excercise is creating 3-D views of infrared satellite images from McIDAS
using the Visual Basic (VB) language. Three-dimensional views are extremely
useful in displaying storm anatomy. Students download grid-point files in ASCII
format of temperatures from infrared satellite images of interesting weather
situations from McIDAS. They then run a VB program that ceates an oblique 3-D
view of the situation in which height is linearly related to temperature. Using
this procedure, students produced the 3-D (right) view of a deeply occluded
mid-latitude cyclone that occurred over the eastern USA on 11 February 1998.
The EAS Department Weather Station and Computer Laboratory is an integral
part of our curriculum. Students learn to collect data from the Unidata archives
and use McIDAS to analyze the data to understand atmospheric and oceanic phenomena.
Data and analyses available on the Internet also are taught for use in research
projects.