Unidata - To provide the data services, tools, and cyberinfrastructure leadership that advance Earth system science, enhance educational opportunities, and broaden participation. Unidata
         
  advanced  
 

Re: changing display color

Ivy:

Wong Ka Yan Ivy [PG] wrote:
> I would like to ask, using VisAD, is there any method, to draw symbols like
> TC, High, or Low, on the image? Like those shown on the weather map,
> Thanks. I've tried to use Display.Shape, but I fail to do so.

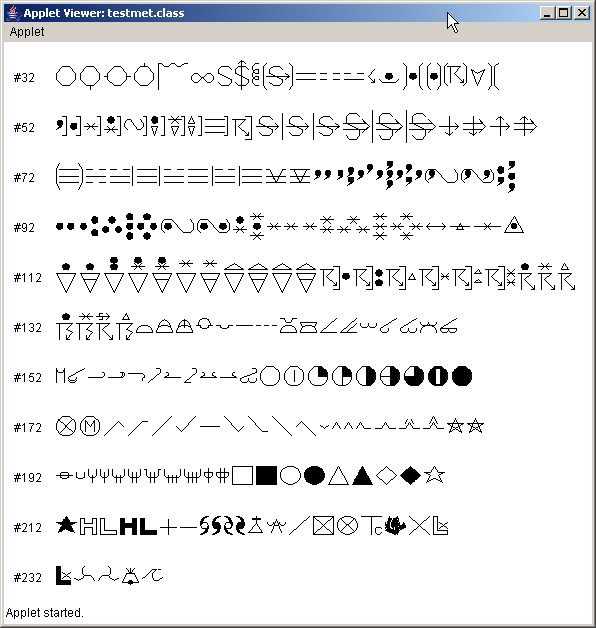
You can use a HersheyFont with VisAD's PlotText class. The wmo.jhf font contains extra symbols. See the attached image. The "string" you would use in render_font() call is then just the "code values" for the characters you want.

tom


Regards, Ivy.

--
Tom Whittaker (tomw@xxxxxxxxxxxxx)
University of Wisconsin-Madison
Space Science and Engineering Center
Cooperative Institute for Meteorological Satellite Studies
Phone/VoiceMail: 608.262.2759

PNG image


  Contact Us     Site Map     Search     Terms and Conditions     Privacy Policy     Participation Policy
 
National Science Foundation (NSF) UCAR Community Programs   Unidata is a member of the UCAR Community Programs, is managed by the University Corporation for Atmospheric Research, and is sponsored by the National Science Foundation.
P.O. Box 3000     Boulder, CO 80307-3000 USA     Tel: 303-497-8643     Fax: 303-497-8690