Use of Unidata Data Visualization and Analysis Packages (GEMPAK, IDV, McIDAS)
Use of Unidata Data Access Tools (LDM/IDD, TDS, RAMADDA)
Use of Unidata Data Management Tools (netCDF, CDM, libCF, UDUNITS)
Educators and Students
Unidata Community Services
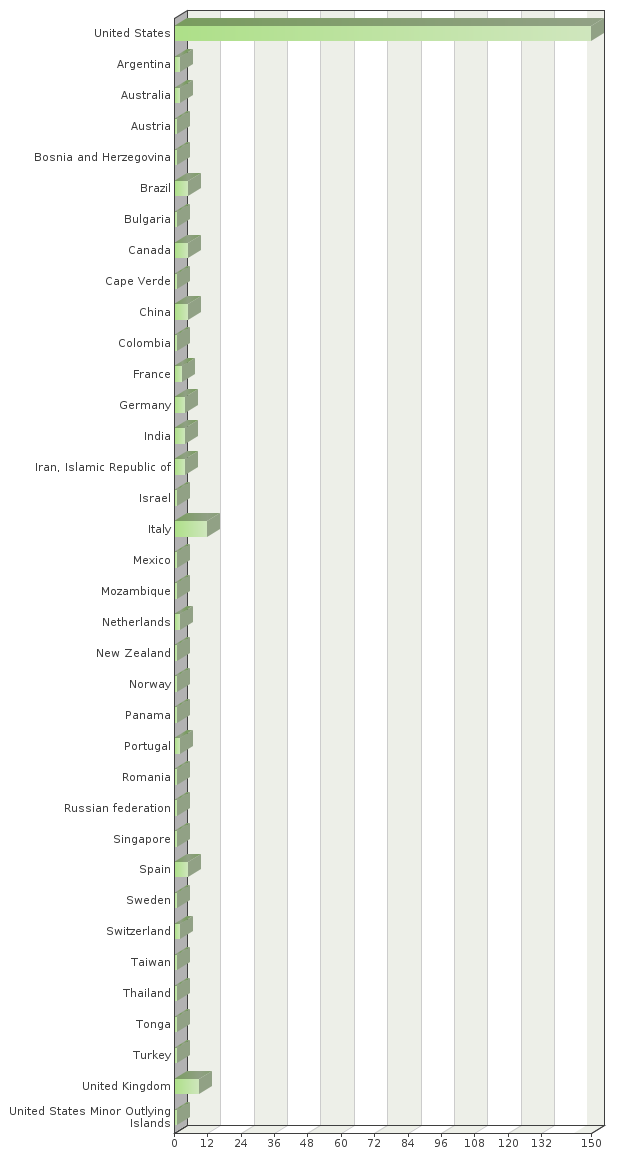
| Country of residence | Absolute frequency | Relative frequency | Adjusted relative frequency |
|---|---|---|---|
| United States | 150 | 62.5% | 63.56% |
| Argentina | 2 | 0.83% | 0.85% |
| Australia | 2 | 0.83% | 0.85% |
| Austria | 1 | 0.42% | 0.42% |
| Bosnia and Herzegovina | 1 | 0.42% | 0.42% |
| Brazil | 5 | 2.08% | 2.12% |
| Bulgaria | 1 | 0.42% | 0.42% |
| Canada | 5 | 2.08% | 2.12% |
| Cape Verde | 1 | 0.42% | 0.42% |
| China | 5 | 2.08% | 2.12% |
| Colombia | 1 | 0.42% | 0.42% |
| France | 3 | 1.25% | 1.27% |
| Germany | 4 | 1.67% | 1.69% |
| India | 4 | 1.67% | 1.69% |
| Iran, Islamic Republic of | 4 | 1.67% | 1.69% |
| Israel | 1 | 0.42% | 0.42% |
| Italy | 12 | 5% | 5.08% |
| Mexico | 1 | 0.42% | 0.42% |
| Mozambique | 1 | 0.42% | 0.42% |
| Netherlands | 2 | 0.83% | 0.85% |
| New Zealand | 1 | 0.42% | 0.42% |
| Norway | 1 | 0.42% | 0.42% |
| Panama | 1 | 0.42% | 0.42% |
| Portugal | 2 | 0.83% | 0.85% |
| Romania | 1 | 0.42% | 0.42% |
| Russian federation | 1 | 0.42% | 0.42% |
| Singapore | 1 | 0.42% | 0.42% |
| Spain | 5 | 2.08% | 2.12% |
| Sweden | 1 | 0.42% | 0.42% |
| Switzerland | 2 | 0.83% | 0.85% |
| Taiwan | 1 | 0.42% | 0.42% |
| Thailand | 1 | 0.42% | 0.42% |
| Tonga | 1 | 0.42% | 0.42% |
| Turkey | 1 | 0.42% | 0.42% |
| United Kingdom | 9 | 3.75% | 3.81% |
| United States Minor Outlying Islands | 1 | 0.42% | 0.42% |
| Not answered: | 4 | 1.67% | - |
| Sum: | 240 | 100% | 100% |
| Total answered: 236 | |||
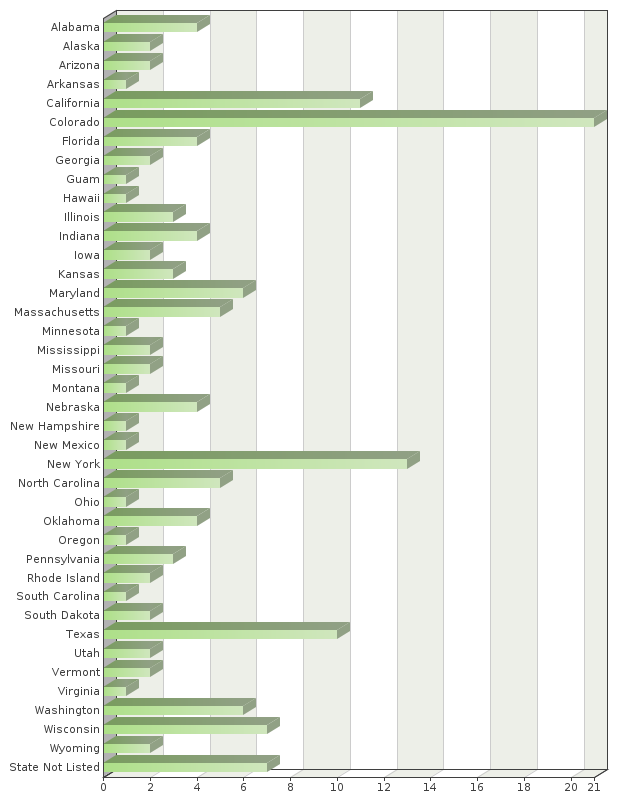
| US state of residence | Absolute frequency | Relative frequency | Adjusted relative frequency |
|---|---|---|---|
| Alabama | 4 | 1.67% | 2.61% |
| Alaska | 2 | 0.83% | 1.31% |
| Arizona | 2 | 0.83% | 1.31% |
| Arkansas | 1 | 0.42% | 0.65% |
| California | 11 | 4.58% | 7.19% |
| Colorado | 21 | 8.75% | 13.73% |
| Florida | 4 | 1.67% | 2.61% |
| Georgia | 2 | 0.83% | 1.31% |
| Guam | 1 | 0.42% | 0.65% |
| Hawaii | 1 | 0.42% | 0.65% |
| Illinois | 3 | 1.25% | 1.96% |
| Indiana | 4 | 1.67% | 2.61% |
| Iowa | 2 | 0.83% | 1.31% |
| Kansas | 3 | 1.25% | 1.96% |
| Maryland | 6 | 2.5% | 3.92% |
| Massachusetts | 5 | 2.08% | 3.27% |
| Minnesota | 1 | 0.42% | 0.65% |
| Mississippi | 2 | 0.83% | 1.31% |
| Missouri | 2 | 0.83% | 1.31% |
| Montana | 1 | 0.42% | 0.65% |
| Nebraska | 4 | 1.67% | 2.61% |
| New Hampshire | 1 | 0.42% | 0.65% |
| New Mexico | 1 | 0.42% | 0.65% |
| New York | 13 | 5.42% | 8.5% |
| North Carolina | 5 | 2.08% | 3.27% |
| Ohio | 1 | 0.42% | 0.65% |
| Oklahoma | 4 | 1.67% | 2.61% |
| Oregon | 1 | 0.42% | 0.65% |
| Pennsylvania | 3 | 1.25% | 1.96% |
| Rhode Island | 2 | 0.83% | 1.31% |
| South Carolina | 1 | 0.42% | 0.65% |
| South Dakota | 2 | 0.83% | 1.31% |
| Texas | 10 | 4.17% | 6.54% |
| Utah | 2 | 0.83% | 1.31% |
| Vermont | 2 | 0.83% | 1.31% |
| Virginia | 1 | 0.42% | 0.65% |
| Washington | 6 | 2.5% | 3.92% |
| Wisconsin | 7 | 2.92% | 4.58% |
| Wyoming | 2 | 0.83% | 1.31% |
| State Not Listed | 7 | 2.92% | 4.58% |
| Not answered: | 87 | 36.25% | - |
| Sum: | 240 | 100% | 100% |
| Total answered: 153 | |||
| Non-US state/province of residence |
|---|
| Rio de Janeiro |
| Berkshire |
| Galicia |
| WI |
| Lazio |
| Europe |
| Milan |
| Aveiro |
| Tasmania |
| Maharashtra |
| Pv |
| Wien |
| Quebec |
| Madrid |
| Rio de Janeiro |
| Cundinamarca |
| L'Aquila |
| Oxfordshire |
| Brandenburg |
| La Spezia |
| Berkshire |
| Beijing |
| NRW |
| Quebec |
| Si Chuan Province |
| Espirito Santo |
| Sao Paulo |
| Ile de France |
| Maharashtra |
| Saint-Petersburg |
| Noord-Holland |
| Oslo |
| England |
| Tel-Aviv district |
| Jalisco |
| Glestan |
| Jujuy |
| Khorasan razavi |
| Pacific |
| Rio Grande do Sul |
| Trentino |
| England |
| Maputo |
| South-Khorasan |
| Ontario |
| Beijing |
| Zurich |
| Ontario |
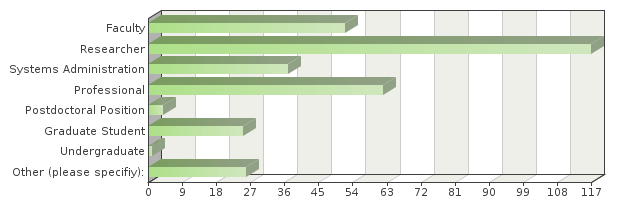
| Professions | Absolute frequency | Relative frequency | Adjusted relative frequency |
|---|---|---|---|
| Faculty | 52 | 16.05% | 21.67% |
| Researcher | 117 | 36.11% | 48.75% |
| Systems Administration | 37 | 11.42% | 15.42% |
| Professional | 62 | 19.14% | 25.83% |
| Postdoctoral Position | 4 | 1.23% | 1.67% |
| Graduate Student | 25 | 7.72% | 10.42% |
| Undergraduate | 1 | 0.31% | 0.42% |
| Other (please specifiy): | 26 | 8.02% | 10.83% |
| Sum: | 324 | 100% | 100% |
| Total answered: 240 | |||
| Other professions listed |
|---|
| Forecaster |
| Web and data developer |
| Private research use |
| Contractor to NOAA |
| Staff Meteorologist |
| Data manager |
| Software Engineering |
| Meteorologist |
| Software developer |
| Scientific Programming |
| Programmer |
| Unidata Staff |
| Environmental Health Scientist/Federal Government |
| Gov. Contractor |
| Public Safety |
| Private co |
| Private |
| Software developer |
| M.Sc student |
| Government |
| Data manager |
| Forecaster |
| data integration planner |
| Weather Buff |
| Retired |
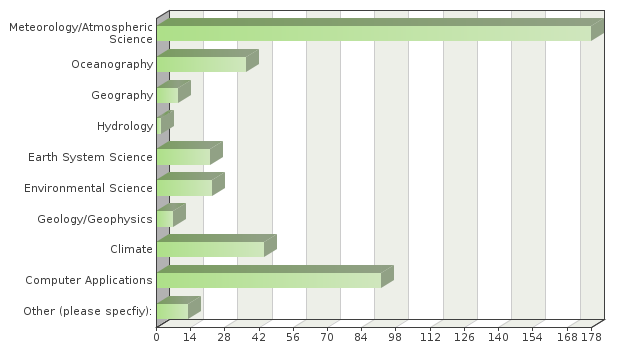
| Area(s) of study/specialization | Absolute frequency | Relative frequency | Adjusted relative frequency |
|---|---|---|---|
| Meteorology/Atmospheric Science | 178 | 41.69% | 74.17% |
| Oceanography | 37 | 8.67% | 15.42% |
| Geography | 9 | 2.11% | 3.75% |
| Hydrology | 2 | 0.47% | 0.83% |
| Earth System Science | 22 | 5.15% | 9.17% |
| Environmental Science | 23 | 5.39% | 9.58% |
| Geology/Geophysics | 7 | 1.64% | 2.92% |
| Climate | 44 | 10.3% | 18.33% |
| Computer Applications | 92 | 21.55% | 38.33% |
| Other (please specfiy): | 13 | 3.04% | 5.42% |
| Sum: | 427 | 100% | 100% |
| Total answered: 240 | |||
| Other areas of study/specialization listed |
|---|
| Energy Policy |
| Space Systems |
| Language |
| Statistics |
| Architecture |
| Real-time operations |
| Data science |
| Computer Science, Chemistry, Biology |
| Unidata Staff |
| Satellite remote sensing |
| Ecology |
| Fluid dynamics |
| Snow Science |
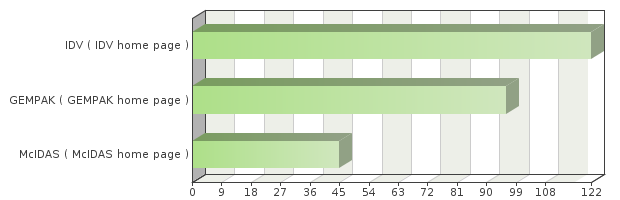
| Unidata Data Visualization and Analysis packages used | Absolute frequency | Relative frequency | Adjusted relative frequency |
|---|---|---|---|
| IDV | 122 | 46.39% | 68.16% |
| GEMPAK | 96 | 36.5% | 53.63% |
| McIDAS | 45 | 17.11% | 25.14% |
| Sum: | 263 | 100% | 100% |
| Total answered: 179 | |||
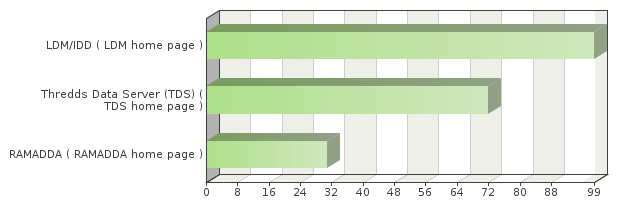
| Unidata Data Access tools used | Absolute frequency | Relative frequency | Adjusted relative frequency |
|---|---|---|---|
| LDM/IDD | 99 | 49.01% | 66.44% |
| Thredds Data Server (TDS) | 72 | 35.64% | 48.32% |
| RAMADDA | 31 | 15.35% | 20.81% |
| Sum: | 202 | 100% | 100% |
| Total answered: 149 | |||
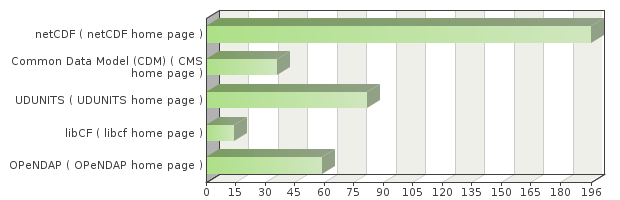
| Unidata Data Management tools used | Absolute frequency | Relative frequency | Adjusted relative frequency |
|---|---|---|---|
| netCDF | 196 | 50.65% | 96.55% |
| Common Data Model (CDM) | 36 | 9.3% | 17.73% |
| UDUNITS | 82 | 21.19% | 40.39% |
| libCF | 14 | 3.62% | 6.9% |
| OPeNDAP | 59 | 15.25% | 29.06% |
| Sum: | 387 | 100% | 100% |
| Total answered: 203 | |||
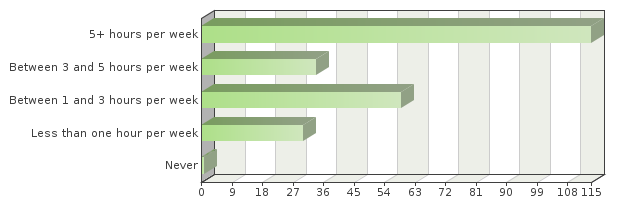
| Unidata packages/tools frequency of use | Absolute frequency | Relative frequency | Adjusted relative frequency |
|---|---|---|---|
| 5+ hours per week | 115 | 47.92% | 48.12% |
| Between 3 and 5 hours per week | 34 | 14.17% | 14.23% |
| Between 1 and 3 hours per week | 59 | 24.58% | 24.69% |
| Less than one hour per week | 30 | 12.5% | 12.55% |
| Never | 1 | 0.42% | 0.42% |
| Sum: | 239 | 100% | 100% |
| Total answered: 239 | |||
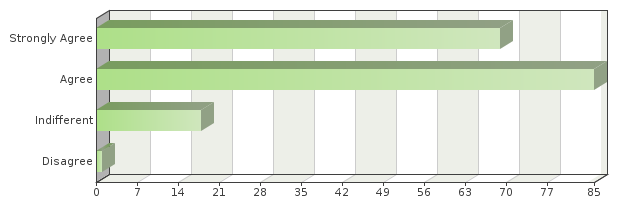
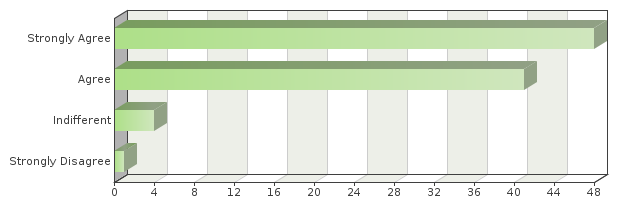
| Level of agreement | Absolute frequency | Relative frequency | Adjusted relative frequency |
|---|---|---|---|
| Strongly Agree | 69 | 28.75% | 39.88% |
| Agree | 85 | 35.42% | 49.13% |
| Indifferent | 18 | 7.5% | 10.4% |
| Disagree | 1 | 0.42% | 0.58% |
| Sum: | 173 | 100% | 100% |
| Total answered: 173 | |||
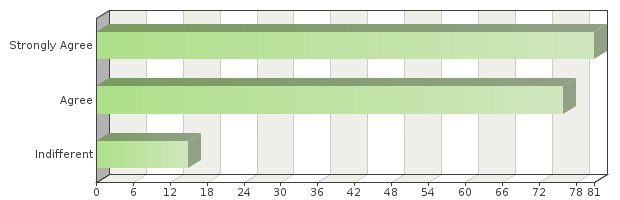
| Level of agreement | Absolute frequency | Relative frequency | Adjusted relative frequency |
|---|---|---|---|
| Strongly Agree | 81 | 33.75% | 47.09% |
| Agree | 76 | 31.67% | 44.19% |
| Indifferent | 15 | 6.25% | 8.72% |
| Sum: | 172 | 100% | 100% |
| Total answered: 172 | |||
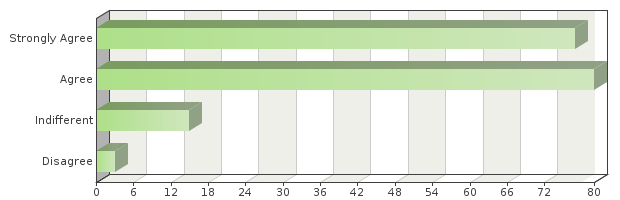
| Level of agreement | Absolute frequency | Relative frequency | Adjusted relative frequency |
|---|---|---|---|
| Strongly Agree | 77 | 32.08% | 44% |
| Agree | 80 | 33.33% | 45.71% |
| Indifferent | 15 | 6.25% | 8.57% |
| Disagree | 3 | 1.25% | 1.71% |
| Sum: | 175 | 100% | 100% |
| Total answered: 175 | |||
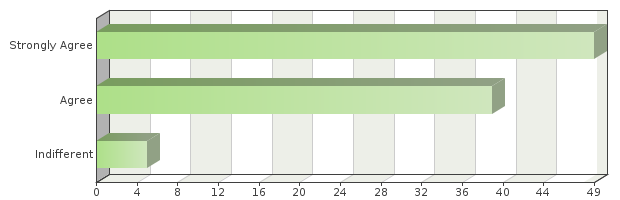
| Level of agreement | Absolute frequency | Relative frequency | Adjusted relative frequency |
|---|---|---|---|
| Strongly Agree | 49 | 20.42% | 52.69% |
| Agree | 39 | 16.25% | 41.94% |
| Indifferent | 5 | 2.08% | 5.38% |
| Sum: | 93 | 100% | 100% |
| Total answered: 93 | |||
| Level of agreement | Absolute frequency | Relative frequency | Adjusted relative frequency |
|---|---|---|---|
| Strongly Agree | 48 | 20% | 51.06% |
| Agree | 41 | 17.08% | 43.62% |
| Indifferent | 4 | 1.67% | 4.26% |
| Strongly Disagree | 1 | 0.42% | 1.06% |
| Sum: | 94 | 100% | 100% |
| Total answered: 94 | |||
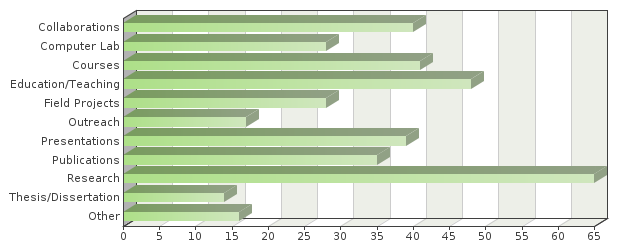
| Data usage | Absolute frequency | Relative frequency | Adjusted relative frequency |
|---|---|---|---|
| Collaborations | 40 | 10.78% | 44.44% |
| Computer Lab | 28 | 7.55% | 31.11% |
| Courses | 41 | 11.05% | 45.56% |
| Education/Teaching | 48 | 12.94% | 53.33% |
| Field Projects | 28 | 7.55% | 31.11% |
| Outreach | 17 | 4.58% | 18.89% |
| Presentations | 39 | 10.51% | 43.33% |
| Publications | 35 | 9.43% | 38.89% |
| Research | 65 | 17.52% | 72.22% |
| Thesis/Dissertation | 14 | 3.77% | 15.56% |
| Other | 16 | 4.31% | 17.78% |
| Sum: | 371 | 100% | 100% |
| Total answered: 90 | |||
| Other data usage listed |
|---|
| Production |
| Storm Ready |
| Personal forecasts |
| Provide forecasts to on campus users, and for our on-campus alerting system |
| Forecast |
| Work |
| Sponsored projects funded by government agencies |
| Operational Forecasting |
| Commercial |
| Forecast contests |
| AWIPS Testing |
| Forecasting |
| Forecast Operations |
| Forecasting |
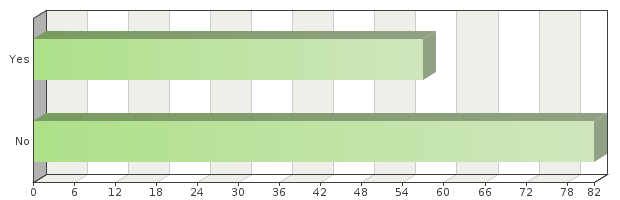
| Familiarity | Absolute frequency | Relative frequency | Adjusted relative frequency |
|---|---|---|---|
| Yes | 57 | 23.75% | 41.01% |
| No | 82 | 34.17% | 58.99% |
| Sum: | 139 | 100% | 100% |
| Total answered: 139 | |||
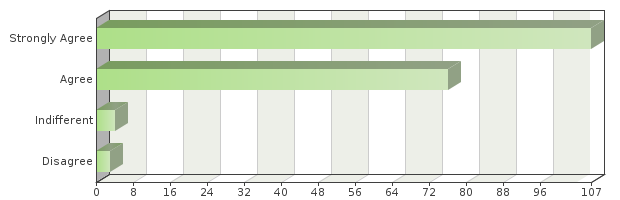
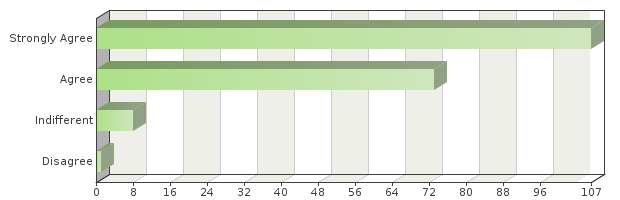
| Level of agreement | Absolute frequency | Relative frequency | Adjusted relative frequency |
|---|---|---|---|
| Strongly Agree | 107 | 44.58% | 56.32% |
| Agree | 76 | 31.67% | 40% |
| Indifferent | 4 | 1.67% | 2.11% |
| Disagree | 3 | 1.25% | 1.58% |
| Sum: | 190 | 100% | 100% |
| Total answered: 190 | |||
| Level of agreement | Absolute frequency | Relative frequency | Adjusted relative frequency |
|---|---|---|---|
| Strongly Agree | 107 | 44.58% | 56.61% |
| Agree | 73 | 30.42% | 38.62% |
| Indifferent | 8 | 3.33% | 4.23% |
| Disagree | 1 | 0.42% | 0.53% |
| Sum: | 189 | 100% | 100% |
| Total answered: 189 | |||
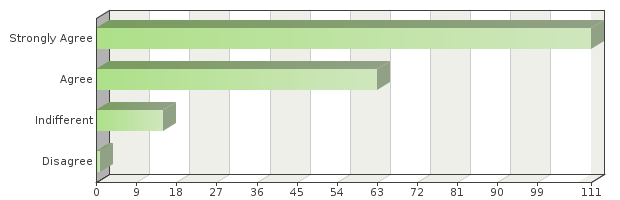
| Level of agreement | Absolute frequency | Relative frequency | Adjusted relative frequency |
|---|---|---|---|
| Strongly Agree | 111 | 46.25% | 58.42% |
| Agree | 63 | 26.25% | 33.16% |
| Indifferent | 15 | 6.25% | 7.89% |
| Disagree | 1 | 0.42% | 0.53% |
| Sum: | 190 | 100% | 100% |
| Total answered: 190 | |||
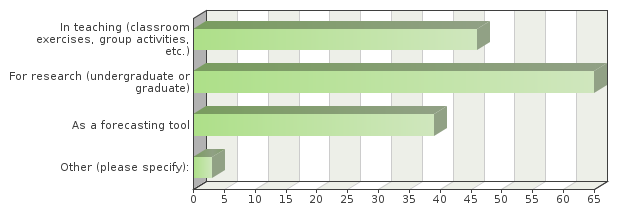
| Unidata Data Visualization and Analysis Package use | Absolute frequency | Relative frequency | Adjusted relative frequency |
|---|---|---|---|
| In teaching (classroom exercises, group activities, etc.) | 46 | 30.07% | 63.01% |
| For research (undergraduate or graduate) | 65 | 42.48% | 89.04% |
| As a forecasting tool | 39 | 25.49% | 53.42% |
| Other (please specify): | 3 | 1.96% | 4.11% |
| Sum: | 153 | 100% | 100% |
| Total answered: 73 | |||
| Other package use listed |
|---|
| Field Studies |
| Fun! |
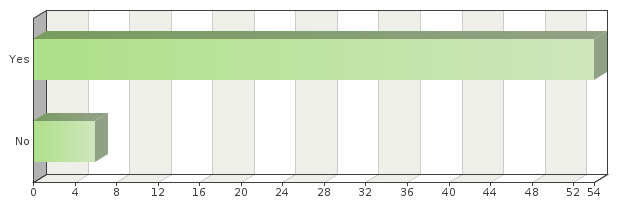
| Level of agreement | Absolute frequency | Relative frequency | Adjusted relative frequency |
|---|---|---|---|
| Yes | 54 | 22.5% | 90% |
| No | 6 | 2.5% | 10% |
| Sum: | 60 | 100% | 100% |
| Total answered: 60 | |||

| Awareness of Unidata workshops | Absolute frequency | Relative frequency | Adjusted relative frequency |
|---|---|---|---|
| Yes | 187 | 77.92% | 89.9% |
| No | 21 | 8.75% | 10.1% |
| Sum: | 208 | 100% | 100% |
| Total answered: 208 | |||
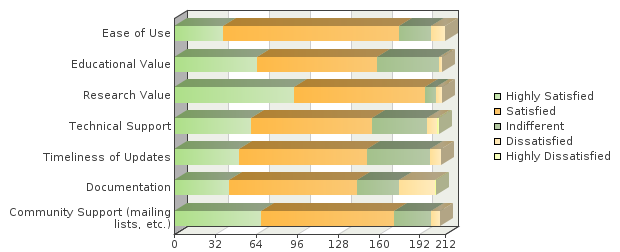
| Highly Satisfied | Satisfied | Indifferent | Dissatisfied | Highly Dissatisfied | Sum | ||
|---|---|---|---|---|---|---|---|
| Ease of Use | Absolute frequency Relative frequency Adjusted Relative frequency |
38 17.92% 2.6% |
138 65.09% 9.45% |
25 11.79% 1.71% |
11 5.19% 0.75% |
0 0% 0% |
212 100% 14.51% |
| Educational Value | Absolute frequency Relative frequency Adjusted Relative frequency |
65 30.95% 4.45% |
94 44.76% 6.43% |
48 22.86% 3.29% |
3 1.43% 0.21% |
0 0% 0% |
210 100% 14.37% |
| Research Value | Absolute frequency Relative frequency Adjusted Relative frequency |
94 44.76% 6.43% |
102 48.57% 6.98% |
9 4.29% 0.62% |
5 2.38% 0.34% |
0 0% 0% |
210 100% 14.37% |
| Technical Support | Absolute frequency Relative frequency Adjusted Relative frequency |
60 28.99% 4.11% |
95 45.89% 6.5% |
43 20.77% 2.94% |
8 3.86% 0.55% |
1 0.48% 0.07% |
207 100% 14.17% |
| Timeliness of Updates | Absolute frequency Relative frequency Adjusted Relative frequency |
51 24.4% 3.49% |
100 47.85% 6.84% |
49 23.44% 3.35% |
9 4.31% 0.62% |
0 0% 0% |
209 100% 14.31% |
| Documentation | Absolute frequency Relative frequency Adjusted Relative frequency |
43 20.98% 2.94% |
100 48.78% 6.84% |
33 16.1% 2.26% |
28 13.66% 1.92% |
1 0.49% 0.07% |
205 100% 14.03% |
| Community Support (mailing lists, etc.) | Absolute frequency Relative frequency Adjusted Relative frequency |
68 32.69% 4.65% |
104 50% 7.12% |
29 13.94% 1.98% |
7 3.37% 0.48% |
0 0% 0% |
208 100% 14.24% |
| Sum | Absolute frequency Relative frequency Adjusted Relative frequency |
419 100% 28.68% |
733 100% 50.17% |
236 100% 16.15% |
71 100% 4.86% |
2 100% 0.14% |
1461 100% 100% |
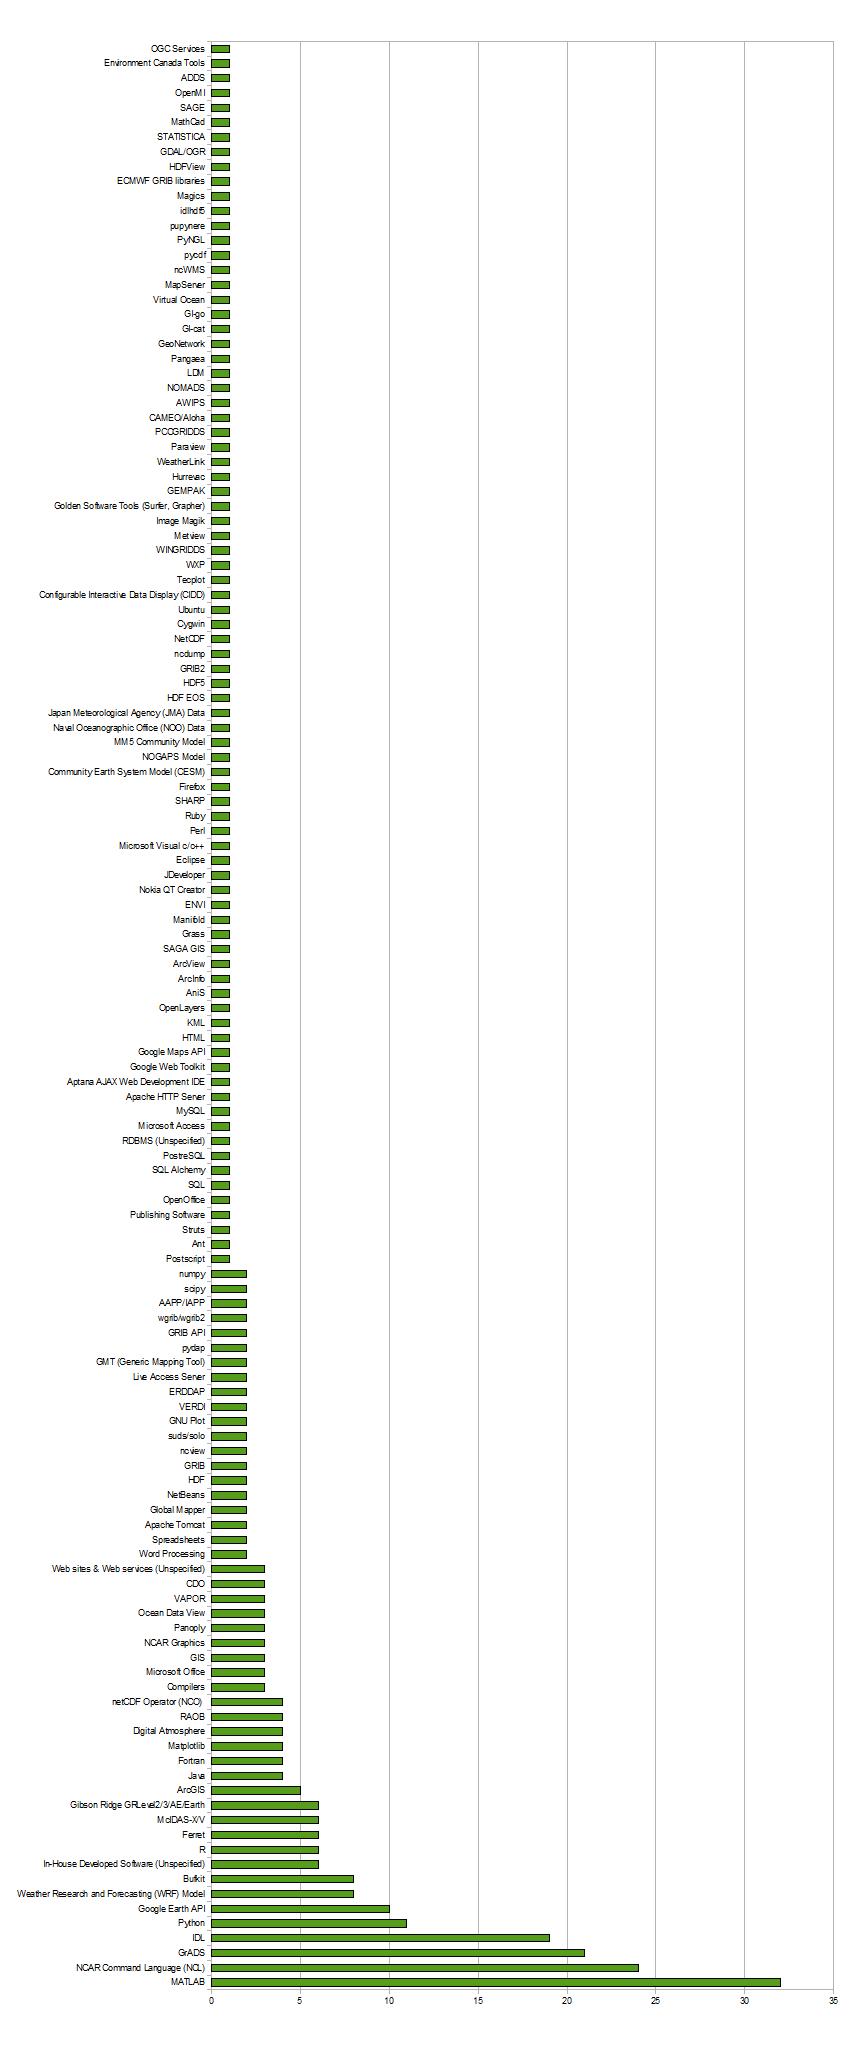
| Non-Unidata Tools Used | Absolute frequency | Relative frequency |
|---|---|---|
| MATLAB | 32 | 9.4% |
| NCAR Command Language (NCL) | 24 | 7.0% |
| GrADS | 21 | 6.1% |
| IDL | 19 | 5.6% |
| Python | 11 | 3.2% |
| Google Earth API | 10 | 2.9% |
| Weather Research and Forecasting (WRF) Model | 8 | 2.3% |
| Bufkit | 8 | 2.3% |
| In-House Developed Software (Unspecified) | 6 | 1.8% |
| R | 6 | 1.8% |
| Ferret | 6 | 1.8% |
| McIDAS-X/V | 6 | 1.8% |
| Gibson Ridge GRLevel2/3/AE/Earth | 6 | 1.8% |
| ArcGIS | 5 | 1.5% |
| Java | 4 | 1.2% |
| Fortran | 4 | 1.2% |
| Matplotlib | 4 | 1.2% |
| Digital Atmosphere | 4 | 1.2% |
| RAOB | 4 | 1.2% |
| netCDF Operator (NCO) | 4 | 1.2% |
| Compilers | 3 | 0.9% |
| Microsoft Office | 3 | 0.9% |
| GIS | 3 | 0.9% |
| NCAR Graphics | 3 | 0.9% |
| Panoply | 3 | 0.9% |
| Ocean Data View | 3 | 0.9% |
| VAPOR | 3 | 0.9% |
| CDO | 3 | 0.9% |
| Web sites & Web services (Unspecified) | 3 | 0.9% |
| Word Processing | 2 | 0.6% |
| Spreadsheets | 2 | 0.6% |
| Apache Tomcat | 2 | 0.6% |
| Global Mapper | 2 | 0.6% |
| NetBeans | 2 | 0.6% |
| HDF | 2 | 0.6% |
| GRIB | 2 | 0.6% |
| ncview | 2 | 0.6% |
| suds/solo | 2 | 0.6% |
| GNU Plot | 2 | 0.6% |
| VERDI | 2 | 0.6% |
| ERDDAP | 2 | 0.6% |
| Live Access Server | 2 | 0.6% |
| GMT (Generic Mapping Tool) | 2 | 0.6% |
| pydap | 2 | 0.6% |
| GRIB API | 2 | 0.6% |
| wgrib/wgrib2 | 2 | 0.6% |
| AAPP/IAPP | 2 | 0.6% |
| scipy | 2 | 0.6% |
| numpy | 2 | 0.6% |
| Postscript | 1 | 0.3% |
| Ant | 1 | 0.3% |
| Struts | 1 | 0.3% |
| Publishing Software | 1 | 0.3% |
| OpenOffice | 1 | 0.3% |
| SQL | 1 | 0.3% |
| SQL Alchemy | 1 | 0.3% |
| PostreSQL | 1 | 0.3% |
| RDBMS (Unspecified) | 1 | 0.3% |
| Microsoft Access | 1 | 0.3% |
| MySQL | 1 | 0.3% |
| Apache HTTP Server | 1 | 0.3% |
| Aptana AJAX Web Development IDE | 1 | 0.3% |
| Google Web Toolkit | 1 | 0.3% |
| Google Maps API | 1 | 0.3% |
| HTML | 1 | 0.3% |
| KML | 1 | 0.3% |
| OpenLayers | 1 | 0.3% |
| AniS | 1 | 0.3% |
| ArcInfo | 1 | 0.3% |
| ArcView | 1 | 0.3% |
| SAGA GIS | 1 | 0.3% |
| Grass | 1 | 0.3% |
| Manifold | 1 | 0.3% |
| ENVI | 1 | 0.3% |
| Nokia QT Creator | 1 | 0.3% |
| JDeveloper | 1 | 0.3% |
| Eclipse | 1 | 0.3% |
| Microsoft Visual c/c++ | 1 | 0.3% |
| Perl | 1 | 0.3% |
| Ruby | 1 | 0.3% |
| SHARP | 1 | 0.3% |
| Firefox | 1 | 0.3% |
| Community Earth System Model (CESM) | 1 | 0.3% |
| NOGAPS Model | 1 | 0.3% |
| MM5 Community Model | 1 | 0.3% |
| Naval Oceanographic Office (NOO) Data | 1 | 0.3% |
| Japan Meteorological Agency (JMA) Data | 1 | 0.3% |
| HDF EOS | 1 | 0.3% |
| HDF5 | 1 | 0.3% |
| GRIB2 | 1 | 0.3% |
| ncdump | 1 | 0.3% |
| NetCDF | 1 | 0.3% |
| Cygwin | 1 | 0.3% |
| Ubuntu | 1 | 0.3% |
| Configurable Interactive Data Display (CIDD) | 1 | 0.3% |
| Tecplot | 1 | 0.3% |
| WXP | 1 | 0.3% |
| WINGRIDDS | 1 | 0.3% |
| Metview | 1 | 0.3% |
| Image Magik | 1 | 0.3% |
| Golden Software Tools (Surfer Grapher) | 1 | 0.3% |
| GEMPAK | 1 | 0.3% |
| Hurrevac | 1 | 0.3% |
| WeatherLink | 1 | 0.3% |
| Paraview | 1 | 0.3% |
| PCCGRIDDS | 1 | 0.3% |
| CAMEO/Aloha | 1 | 0.3 |
| AWIPS | 1 | 0.3% |
| NOMADS | 1 | 0.3% |
| LDM | 1 | 0.3% |
| Pangaea | 1 | 0.3% |
| GeoNetwork | 1 | 0.3% |
| GI-cat | 1 | 0.3% |
| GI-go | 1 | 0.3% |
| Virtual Ocean | 1 | 0.3% |
| MapServer | 1 | 0.3% |
| ncWMS | 1 | 0.3% |
| pycdf | 1 | 0.3% |
| PyNGL | 1 | 0.3% |
| pupynere | 1 | 0.3% |
| idlhdf5 | 1 | 0.3% |
| Magics | 1 | 0.3% |
| ECMWF GRIB libraries | 1 | 0.3% |
| HDFView | 1 | 0.3% |
| GDAL/OGR | 1 | 0.3% |
| STATISTICA | 1 | 0.3% |
| MathCad | 1 | 0.3% |
| SAGE | 1 | 0.3% |
| OpenMI | 1 | 0.3% |
| ADDS | 1 | 0.3% |
| Environment Canada Tools | 1 | 0.3% |
| OGC Services | 1 | 0.3% |
| Sum: | 342 | 100% |
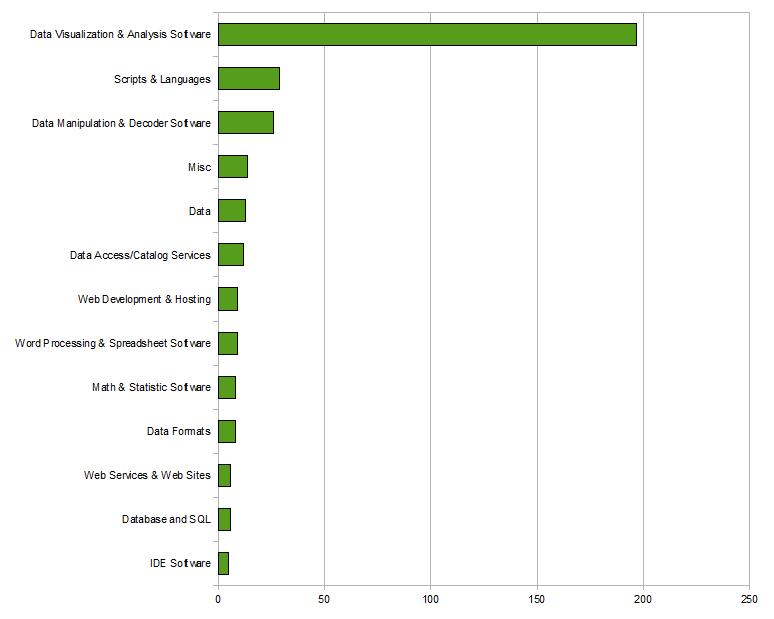
| Non-Unidata Tools Used By Type | Absolute frequency | Relative frequency |
|---|---|---|
| IDE Software | 5 | 1.5 % |
| Database and SQL | 6 | 1.8 % |
| Web Services & Web Sites | 6 | 1.8 % |
| Data Formats | 8 | 2.3 % |
| Math & Statistic Software | 8 | 2.3 % |
| Word Processing & Spreadsheet Software | 9 | 2.6 % |
| Web Development & Hosting | 9 | 2.6 % |
| Data Access/Catalog Services | 12 | 3.5 % |
| Data | 13 | 3.8 % |
| Misc | 14 | 4.1 % |
| Data Manipulation & Decoder Software | 26 | 7.6 % |
| Scripts & Languages | 29 | 8.5 % |
| Data Visualization & Analysis Software | 197 | 57.6 % |
| Sum: | 342 | 100% |
| Non-Unidata tools used |
|---|
| Text input |
| McIDAS-X, McIDAS-V |
| Thick client GIS which reads netCDF |
| mcidas |
| ArcGIS, Access (unfortunately) |
| Ferret, NCL, IDL |
| matlab sage(python) wgrib wgrib2 |
| NCL, NCO, CDO, grads, IDL |
| WRF, Bufkit, Hurrevac, CAMEO/Aloha, spreadsheet, GIS, IDL, MATLAB |
| Matlab, NCL |
| matlab and idl |
| hdf5, IDL |
| IDL |
| NCL, PyNGL, python scientific packages |
| python |
| VERDI, matplotlib |
| OpenLayers; Google Web Toolkit; Apache: Tomcat, Ant, Struts; Java; Eclipse; Ubuntu; Firefox |
| WXP, GRLevel2/3/AE/Earth |
| grads, Gibson Ridge, bufkit |
| WRF and MM5. GrADS. |
| Matlab |
| NCL, IDL, GrADS |
| mySQL |
| NCL, FORTRAN |
| WRF and supporting packages. GRADS. python. |
| matlab |
| Grads. GoogleEarth. Matlab. |
| NCL, VAPOR. I've worked with SWE-derived tools, as well, for moving data that originated from IDD. However, this could be looked on as a testbed for using SWE services to distribute data in a different manner. |
| VAPOR and NCL scripts |
| MATLAB, Google Earth (GIS integration / eye-candy), GIS software (Manifold) |
| GrADS, NCL, MATLAB, R |
| Many software packages such as GR-levelX. This radar tool is superior to other radar visualizations. |
| personal analysis routines in C, python (specifically numpy, scipy, matplotlib, pupynere); various GNU applications, open source applications, the GNU toolchain, etc. |
| matlab R for analysis |
| FORTRAN |
| Postscript |
| html |
| Bufkit |
| Matlab, Grads |
| R and matlab |
| Environment Canada software for viewing model data |
| apache web server |
| Ocean Data View, ArcView, Google Earth, etc. |
| MatLab |
| Matlab |
| ArcGIS, IDL, Ruby |
| SSEC McIDAS |
| GrADS |
| grip-api (ECMWF), cdo and related libraries (MPI Meteorology) |
| NCL Graphics, GrADS, Panoply |
| suds/solo, NCL, Google Earth, WRF |
| Too many to list. |
| wgrib, wgrib2, WRF |
| Java, Matlab |
| ECMWF GRIB libraries, GrADS, NCL, NCO. In my view all WMO binary standards (GRIB, BUFR, etc) should be abandoned with the writing of a WMO convention on NetCDF (extending the CF?). |
| Matlab, JDeveloper |
| Vapor5D (like IDV but better support for model grids - eg. Arakawa-C). |
| Digital Atmosphere (for analysis plots etc). |
| ESRI/ArcGIS, RESC/ncWMS (standalone), GrADS. |
| ERDDAP layer ontop of THREDDS (to address deficiencies/gaps in TDS capabilities and integrate dissparate datasets better). |
| BUFKIT |
| pycdf, pydap and matplotlib |
| ncl, nomads |
| ESRI |
| GrADS |
| GI-cat, GI-go, geonetwork, VirtualOcean |
| ERDDAP |
| Matlab, python, |
| Matlab, Java |
| Primarily NCL, especially since it works so well with WRF output and netCDF data. |
| * OGC services |
| * Google Maps API, Google Earth, KML |
| * GDAL/OGR |
| * GMT |
| * Global Mapper |
| Google Earth, ArcGIS, Bufkit, RAOB, Excel |
| MATLAB, STATISTICA, document publishing tools |
| Programming/data analaysis & display packages like IDL, MatLah, MathCad |
| IDL, ENVI, SQL, Google Earth, Map Server |
| locally written software |
| RAOB, GrLevel3, GRLevelAE, soloii, CIDD |
| Ferret, matlab |
| General Mapping Tool, NCAR Graphics, IDL, Grass, ArchInfo. |
| python, locally written Fortran |
| Publishing software, word processing, statistics software, math software, etc. |
| AWIPS |
| MATLAB, Paraview, OpenMI, ... |
| Unix environment open source tools as well as Mac graphing software |
| IDL, RAOB |
| Java development environment (NetBeans), |
| ncview, ncdump, McIDAS-X, ImageMagik |
| Matlab, IDL, software written at EOL, and ncl. |
| R/MATLAB programming |
| GRLevel2 Analyst. |
| IDL,NCL |
| microsoft visual c/c++, cygwin, gnu c++ and nokia qt creator, mathworks matlab, aptana ajax web development ide, etc. |
| Several websites (e.g., Weathertap). |
| Live Access Server |
| NCL, GrADS |
| netbeans, tomcat |
| McIDAS-V |
| I use NCL, CESM,WRF and ferret |
| Pyton, Gnu-Plot, Grads,IDL |
| Proprietary meteorological display and data distribution tools developed by our company. |
| BUFKIT |
| GNU compilers (C, Fortran 77/90, C++), Perl, Python |
| IDL, MatLab, Web, NOAA Web services |
| IDL, Python, HDF |
| IDL |
| Gibson Ridge, Digital Atmosphere. |
| GrADS, NCL, surfer, grapher, etc. |
| HDFView |
| Global Mapper, GIS, SSEC McIDAS, NOAA Climate & Weather, and many video/animation software packages |
| R, Google Earth, SAGA GIS |
| aapp (atovs and avhrr processing package) from Eumetsat |
| ferret, nco |
| Google Earth |
| in-house (legacy) software for view/manipulate/plot NetCDF files, |
| Matlab, |
| Ferret. |
| ODV (occasionally) |
| Digital Atmosphere, WRF, ATOVS software (like AAPP+IAPP, from UK-MetOffice and Wisc.Univ.respectively), RAOB, Weatherlink (Davis Instruments). |
| Python, pydap, PostgreSQL, SQL Alchemy. |
| ncview |
| OppenOffice, Microsoft Office |
| BUFKIT, Fortran, spread sheets |
| NOGAPS Models, Naval Oceanographic Office Information and Data, USGS, ADDS, |
| grads, matlab |
| Various RDBMSs, Gnuplot, NASA Panoply, Pangaea, NCO suite, Google Earth. |
| Tecplot, IDL, Matlab |
| R, cdo, ncl, parallel netcdf |
| EPA tools such as VERDI |
| Matlab, NCL |
| grib, grib2, python, ncl, grads, matplolib, numpy. scipy |
| office productivity tools, image processing tools, ocean applications (ODV, Ferret, ...) Matlab, LAS, |
| Bufkit |
| NCL |
| Office software, various gridded datasets |
| WINGRIDDS |
| HDF, HDF-EOS, Panoply, GrADS |
| Matlab |
| compilers, grads, Metview, Gribapi, Magics |
| GEMPAK, LDM |
| NCAR graphics and NCL |
| Reanalyses from ECMWF, JMA |
| Grads |
| Aniscode, PCGRIDDS, Digital Atmosphere, SHARP |
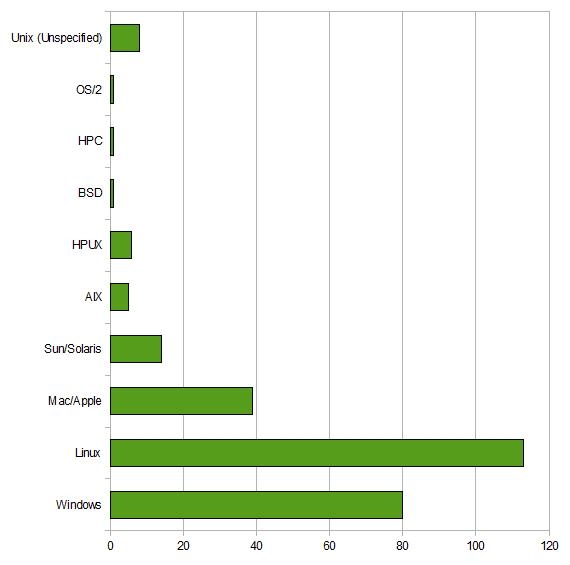
| Hardware/OS | Absolute frequency | Relative frequency |
|---|---|---|
| Windows | 80 | 29.9% |
| Linux | 113 | 42.2% |
| Mac/Apple | 39 | 14.6% |
| Sun/Solaris | 14 | 5.2% |
| AIX | 5 | 1.9% |
| HPUX | 6 | 2.2% |
| BSD | 1 | 0.4% |
| HPC | 1 | 0.4% |
| OS/2 | 1 | 0.4% |
| Unix (Unspecified) | 8 | 3.0% |
| Sum: | 268 | 100% |
| Hardware and operating systems used within department |
|---|
| Linux, iOS, Windows, OS/2 |
| Linux based |
| Dell, RH linux, Mac OSX |
| MSWindows, Linux, HPC IBMs |
| linux |
| Windows, Ubuntu, Linux. |
| Linux, Mac |
| Dell desktops -- Linux (RHE 4/5)and Windows |
| IBM supercomputers -- AIX |
| linux/macs/pcs redhat linux. latest max. don't know about PC.s |
| Linux, Windows |
| Linux clusters |
| RHEL and Windows XP Pro |
| linux, pc, mac |
| Linux, OS X, Windows |
| linux and winXP. |
| Linux |
| Linux on Dell |
| PC hardware, windows/linux |
| Unix, Linux, Mac, Windows |
| Commodity desktops running Fedora Linux |
| CentOS 5.5, Windows 7, Quad core intel processors and Core i7 3 GHZ processors, minimum 500 GB hard drives |
| mostly linux, 64-bit Dell PCs. These machines are dual-boot so that windows can also be used. We have a 72 node linux cluster for more serious computing |
| 2 Linux clusters, several Linux workstations for modeling, data management, LDM, Gempak, and many Windows PCs for student use (display data, run Gempak through X-windows) and for sharing of images. Several flavors of Linux, and Windows XP. |
| PC, Mac, Linux/Unix |
| Linux, Mac, PC |
| Dell, LINUX |
| RHEL, Windows, MacIS |
| Multicore workstations. SuSE and Debian Linux, Windows. Mac |
| Linux cluster |
| MacOS, Linux (RedHat), Windows 7. |
| Over 90 TB of spinning media, about 35 systems for data acquisition, analysis, archival, and data-serving, and several supercomputers. Note that this is not in the ATMO dept here. |
| Llinux box (X64, Fedora based, Quadcore) and MacBookPro (Snow Leopard) for my personal use, a JS21 IBM blade server as the front hardware, but most of the people use W7 or WXP |
| Linux, Windows |
| Operational servers - ranging from older Pentium to Xeon quad-core for numerical modelling, running Debian and CentOS - , workstations - Dell thin-clients and others, Windows and Linux (Debian, mostly for researchers / grad students) |
| AIX, Redhat Linux, SUN OS, Windows XP, Windows 7, and access to various supercomputing clusters |
| PC's, Macs, Linux Servers running Debian. |
| Various OSs (Linux, OSX, BSD, Windows [virtualization]), simple to advanced desktop machines, various sized webservers, small computational clusters. |
| mostly linux and unix some windows |
| Windows XP |
| Mac laptop OS 10.6 |
| pc's, windows xp |
| Several unix workstation and servers and few Windows PCs |
| We have IBM P series and X series machines , HP Server. operating system AIX, HPUX ,Linux and Windows. |
| PCs+Windows+Linux |
| sun4u sparc SUNW,Sun-Fire-V440+SunOS+Linux |
| Nec |
| 5 Linux servers, 2 for data processing, one with 1 Tb hard-disk bay. |
| Linux SLES 11, IBM and Hp |
| Windows XP, |
| Linux, windows and osx |
| PC with Windows XP |
| Both Linux and Windows |
| Sun workstations, Windows |
| pc with linux |
| HP |
| Dell |
| Linux |
| Windows |
| Linux using AMD/Intel |
| AIX, Linux, MacOSX |
| Servers and workstations with Debian, Ubuntu and Suse Linux |
| Our workstations are PCs running Ubuntu Linux, Windows 7 via dual boot. Several Linux based servers. |
| Linux, Solaris, MacOS-X, AIX, HP-UX, Windows |
| Linux PC Clusters |
| Mac OS, Windows (XP and 7), Linux (Ubuntu and RHEL), HP-UX |
| Windows XP-Pro, Linux on PC-based workstations and servers. |
| 75% Linux (desktop & clusters), some 20% prefer Microsoft on desktop, sparse Macs, some legacy Unices (mostly Sun's and Alphas) for the nostalgic. |
| Linux, Windows |
| HP ProLiant-series, RocketCalc cluster appliances, Viglen HPC clusters, Dell storage servers, Lacie and Buffalo NAS appliances. |
| Linux, Windows XP/Vista/7, Windows Server 2003/2008. |
| Linux and Windows PCs |
| mac (osx), linux (redhat, ubuntu) , pc (win xp, vista, win7) |
| WinXP, Win7, MacOS |
| 64bit Redhat (Centos) PC network on one HP server |
| Linux / Windows / DELL |
| OS used: Windows XP, Windows 7, Ubuntu, RedHat, Fedora, CentOS. |
| Hardware: mostly Dell servers and desktops. |
| PC & linux |
| Windows, Linux, OS X |
| linux, windows |
| Windows, Linux |
| Mac OSX, Windows |
| Linux/Windows PCs, Macs, Solaris machines. Lots of incoming data processed through multiple machines. |
| * Linux (CentOS) |
| * Windows |
| PCs, clusters |
| Linux, Windows, Mac |
| various flavors of Linux, Microsoft Windows 7 |
| Mainly Windows, some Linux |
| Many Linux servers, mac and pc desktops |
| linux, Windows |
| Various windows os, Debian and Redhat Linux flavors, Apple OS versions and a wide variety of hardware ranging from laptops through server clusters. |
| x86 servers, Linux CentOS. |
| Linux, Mac, and Windows - Intel based hardware. |
| Sun, Dell intel-based hardware |
| Solaris, Linux, Windows XP |
| Most are Linux > CentOS 5.4 as well as MS Windows on older machines. |
| Intel-based computers running either Win XP Pro or Redhat Enterprise Linux |
| Windows XP, Windows 7, Various Linux distributions |
| SuSE Linux i586 |
| Centos Linux i386 and x86_64 |
| Solaris Sparc |
| Mac, Unix (Gentoo), PC (Windows XP & 7), Solaris Unix |
| intel linux sun sparc |
| Linux, Mac, Windows |
| Servers are all Linux (CentOS 5 I think). Desktops are mixture of Linux, Windows, Mac and Solaris. |
| mac, PC, Linux, Unix |
| Redhat Linux, Windows, OSX on 32 and 64 bit x86 |
| workstations and servers. |
| Linux |
| Windows XP, 7 and Linux (Red Hat) |
| windows, unix |
| Linux 64 bit system computers with OS Mandriva |
| Mac OS(Snow Leopard), Windows(XP,Windows 7). |
| Solaris Sparc, Solaris x86 |
| mcgill university geograsphy department's hardware, would be too long to describe in here, (in the lab I work) unix machine from sun, intel based sun workstation, multiple ms-win os desktops, unaware of the depatment-level big picture. |
| ~30 PCs, dual-booted Windows and Linux |
| Linux virtualized in an IBM Blade |
| Red Hat Linux Enterprise; Dell servers. |
| Mac OS-X, Linux |
| windwos7(64), Centos5 |
| UNIX |
| MS Windows 7 and Linux, both 64-bit |
| I have a 64 bit Linux PC running on the Fedora 12 platform; I also have access to NCAR bluefire and a local Linux cluster. |
| Mac, Windows, Linux |
| Numerous Intel x86 and x86-64 servers |
| Linux (CentOS, Debian) |
| Windows XP, Vista, 7 |
| Windows-based PCs and server; a few MAC |
| AIX, Solaris, Windows |
| LINUX, Windows |
| Single and multi-core x86 systems as well as multi-core x64. I use a variety of dedicated servers as well as end-user pc systems. |
| windows/linux; |
| PC and PC cluster, IBM super computer |
| i386 CentOS/Windows7/MacOS |
| pc, mac, linux/cluster |
| SUNOS, UNIX, MacOS |
| Multiple PC, laptop, networking, etc. |
| Windows, OS X, Linux, Unix |
| PC/linux(centos) and SUN/Solaris |
| SGI-Altix ICE, SUSE-enterprise Linux |
| Linux workstations |
| MacosX personal comupters |
| Centos/AMD/Intel |
| Linux servers/ RedHat / Apache |
| Microsoft Win7(XP,2K) |
| Apple OS-X |
| Pentium processors. |
| MS XP & 2003/2008 Server, and VMWare with Ubuntu and Debian virtual machines. |
| Macs, OSX, HP blades, RHEL5, Windows. |
| linux, windows |
| PC, Windows |
| Dell Precision Workstation 7500 plus 32 PC's with |
| GEMPAK5.11.4 for students access. |
| Windows Linux -- Not sure about hardware |
| pc's - linux |
| cluster - pc's - linux |
| Linux, Mac OS X, UNIX, Windows. |
| Mostly MS-Win platforms, some Linux |
| Series of small PC's and multi-core computers. Some systems are running MS Windows and the rest is using various distributions of Linux |
| Solaris |
| linux cluster |
| Linux, Sun Solaris, OSX, Windows XP & Windows 7 |
| A few legacy Sparc machines; rest is Intel with a few AMD; mostly 64-bit multi-core |
| Linux |
| linux & Windows |
| Custom built quad-core processor, 8Gb of memory, 500gb hard-drive. Fedora 13 64-bit. Bufkit installed on Windows 7 partition. |
| Linux, Linux cluster |
| Numerous desktops and laptops, mainly Unix-based with a few Sun/Solaris based systems for good measure. |
| HP Windows XP |
| Linux, Mac OS X, Windows |
| LINUX Redhat |
| Sun, IBM, Fujitsu |
| Solaris, Linux, Windows |
| PC Client/Server environment running both Linux and Windows |
| Solaris and Linux |
| linux workstations |
| Redhat Linux, Win XP |
| Linux (Various Distributions) |
| Windows XP |
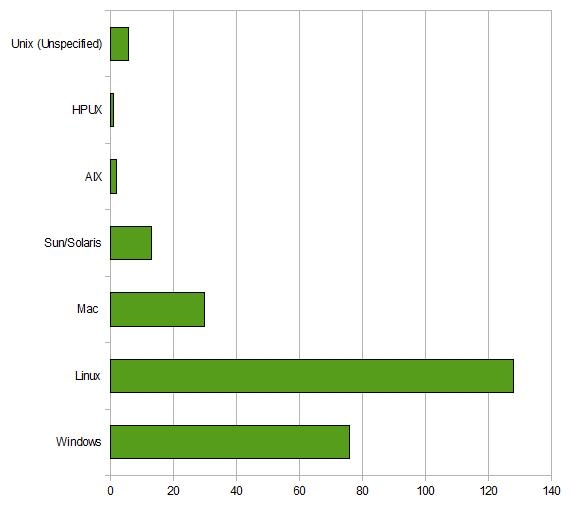
| Hardware/OS | Absolute frequency | Relative frequency |
|---|---|---|
| Windows | 76 | 29.9% |
| Linux | 128 | 50.0% |
| Mac | 30 | 11.7% |
| Sun/Solaris | 13 | 5.1% |
| AIX | 2 | 0.8% |
| HPUX | 1 | 2.3% |
| Unix (Unspecified) | 6 | 2.3% |
| Sum: | 256 | 100% |
| Hardware and operating systems used personally |
|---|
| Dell desktop with Windows 7 64-bit |
| Ditto |
| Dell, RH linux, Mac OSX |
| See 17 |
| pc hpc |
| Windows, Ubuntu |
| Linux, Mac |
| Dell desktops and servers -- Linux RHE 4/5 |
| MAC and linux. |
| Linux |
| MAC OS |
| linux and pc |
| Linux, OS X, Windows |
| linux |
| Linux/Windows desktop quadcore |
| Linux on Dell |
| Mac hardware with OS X |
| Mac, Linux, Unix, Windows, |
| Commodity desktops running Fedora Linux |
| Ubuntu |
| Same as above |
| linux OS (windows on laptop for interaction with others at university). Dell optiplex 745 desktop, Dell Studio XPS laptop. I also use the 72 node linux cluster. |
| Windows XP, Vista, Linux on the same collection of hardware mentioned above -- mostly x-86 workstations/PCs, and the 2 clusters. |
| Sun/Linux |
| Linux |
| Dell, LINUX |
| RHEL, Windows |
| Multicore workstations. SuSE and Debian Linux, Windows |
| Linux |
| MacOS, Linux (RedHat) |
| Linux, Ata-over-Ethernet and iSCSI RAID, Intel and AMD-based PC's and servers |
| MacBookPro 15'' and Linux box (Fedora 10 X64 running on a Quadcore) |
| Linux, Windows, PC |
| 1) Core i3, 6GB RAM, 1TB disk, Windows 7 64bits + CentOS 5.4 |
| 2) HP tx2500us (AMD Turion X2, 3GB RAM, 250GB disk), Windows 7 32bits, Windows Vista Pro 32bits, Fedora 13 (virtualized) |
| Supercomputing clusters, AIX, Redhat Linux, Windows XP |
| Same as above. |
| Intel Core2 Duo CPU T9300@2.50GHz, 8GB RAM. |
| lesserwhirls@microsat-xps:~$ uname -a |
| Linux microsat-xps 2.6.32-24-generic #42-Ubuntu SMP Fri Aug 20 14:21:58 UTC 2010 x86_64 GNU/Linux |
| laptop with linux |
| Windows 95/98/XP |
| DOS |
| Mac G5 OS 10.5 |
| Unix |
| same |
| Both MacOsX and Windows XP |
| Unix workstations and a personal Vaio Windows laptop |
| Xeon workstation, Linux |
| HPUX,AIX,Linux and windows. Mainly use Linux |
| PCs+Windows+Linux |
| sun4u sparc SUNW,Sun-Fire-V440+SunOS+Linux |
| Linux Fedora Core systems / Ubuntu. |
| Dual-core PC servers (outdated, bought in 2005). |
| OpenSuse, Win Xp |
| AMD Athlon, 64 bit |
| linux and osx |
| Same |
| Both Linux and Windows |
| Ditto |
| pc with linux |
| HP |
| Dell |
| Linux |
| Windows |
| Linux and Windows using AMD/Intel |
| AIX, Linux, MacOSX |
| Ubuntu |
| PC running Linux. |
| Solaris, MacOS-X, Linux |
| Linux Debian PC |
| Mac OS X (MacBook Pro) |
| Multi-processor Dell workstation running Scientific Linux |
| Just Linux |
| Intel-based |
| Rocketcalc Saturn mini-clusters, Viglen HPC rackmount clusters, HP DL360 and DL380 servers running linux. |
| Linux, Windows XP/7, Windows Server 2008. |
| Linux, Windows 7, Windows Vista, Windows XP |
| mac (osx), linux (redhat, ubuntu) , pc (win xp, vista, win7) |
| WinXP, Win7, MacOS |
| 64bit Redhat (Centos) PC network on one HP server |
| Linux / Windows / DELL |
| linux |
| All of the above. I work on multiple operating systems / servers. |
| PC and Linux |
| Windows, Linux, OS X |
| linux |
| Window, Linux |
| Mac OSX |
| Primarily Linux/UNIX for data processing and plotting, and Windows for visualization and analysis (easier for writing papers and PowerPoint presentations). Dual-booting makes this easy, though. |
| * Linux (CentOS) |
| * Windows Vista, Dell |
| Linux, Windows |
| AMD Phenom II X4 with Ubuntu |
| Mainly Windows, some Linux |
| Red Hat Linux servers, mac OSX laptop and desktop |
| linux, Windows |
| WinXP, Debian Linux. |
| x86 servers, Linux CentOS. |
| Linux and Mac. |
| Intel-based solaris |
| Same |
| Intel-based computers running either Win XP Pro or Redhat Enterprise Linux |
| Mostly Windows XP, but for time to time all OSs mentioned above |
| SuSE Linux i586 |
| Centos Linux i386 and x86_64 |
| Solaris Sparc |
| Mac + Gentoo; less Solaris and Windows XP |
| Mac and Linux |
| Dell Latitude D430 Laptop, Windows XP |
| mac, PC, Linux, Unix |
| Linux and Windows |
| Linux |
| Windows XP, 7 and Linux. |
| windows |
| Mandriva OS linux computer |
| MacOSX, Ubuntu Linux, Windows XP, Solaris |
| linux redhat fc12 and fc13, redhat linux centos distrib, ms-windows xp, 2003 server and ms-windows 7 |
| PCs and Mac laptop; Windows, Linux, Mac |
| Linux, Windows |
| Red Hat Linux Enterprise; Dell servers. |
| Mac OS-X, Linux |
| Centos5, Windows7 |
| UNIX |
| HP notebooks |
| I use Fedora 12 on the Linux PC |
| Linux,Ubuntu,i686 GNU/Linux,x86_64 x86_64 x86_64 GNU/Linux |
| Linux (Debian) |
| Windows XP Pro |
| MAC and Windows OS PC |
| See above |
| LINUX, Windows |
| All x86 and x64 based hardware. I primarily use linux with windows on one machine for proprietary software. As far as linux flavors, I prefer Gentoo but am required to use CentOS and Ubuntu for some ingestion software. |
| windows/linux, PC and PC cluster |
| linux, windows |
| i386 CentOS/Windows7 |
| linux/cluster |
| MacOS, UNIX, SUNOS |
| Windows & OS X |
| PC/linux(centos) and SUN/Solaris |
| SGI-Altix ICE, Cray XT6, IBM Power 6 |
| Linux variants |
| CentOS/Intel |
| Linux/RedHat |
| MS Win7 |
| the same of the Item#17 |
| Macs, OSX, HP blades, RHEL5, Windows. |
| linux |
| PC, Windows |
| Linux Fedora 13 on another Dell Precision workstation and a Dell desktop. |
| Windows, Linux |
| pc's - linux |
| Linux. UNIX. |
| All: MS-Win, Linux, MacOSX |
| Dell Precision T7500, running RHEL and a smaller dual core PC with Fedora 13 Linux. |
| Linux |
| linux cluster and Windows desktop/laptop |
| Linux (mostly CentOS, a little Ubuntu); OS X, Windows Xp, Vista, 7. |
| Intel/ AMD |
| Linux, 2 x Intel(R) Pentium(R) 4 CPU 3.00GHz, RAM 1025824 kB, HD 122.9 G, I mostly work on network servers tough. |
| various |
| As above |
| Linux |
| For laptops, Mac. For desktops, Fedora. Personally own two of each setup, with one aging Windows machine in case of dire necessity. |
| HP Windows XP |
| Mac OS X |
| LINUX Redhat |
| Sun, IBM, Fujitsu |
| Solaris, Linux, Windows |
| High-end PC running Windows XP and Cygwin |
| Solaris and Linux |
| Win PC, linux |
| Linux and Win XP |
| Intel Core2 Duo E8600 |
| Both Linux and Windows XP |
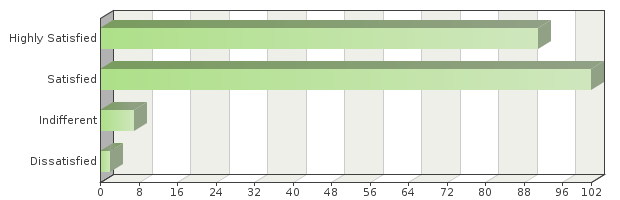
| Level of satisfaction | Absolute frequency | Relative frequency | Adjusted relative frequency |
|---|---|---|---|
| Highly Satisfied | 91 | 37.92% | 45.05% |
| Satisfied | 102 | 42.5% | 50.5% |
| Indifferent | 7 | 2.92% | 3.47% |
| Dissatisfied | 2 | 0.83% | 0.99% |
| Sum: | 202 | 100% | 100% |
| Total answered: 202 | |||