Unidata Support
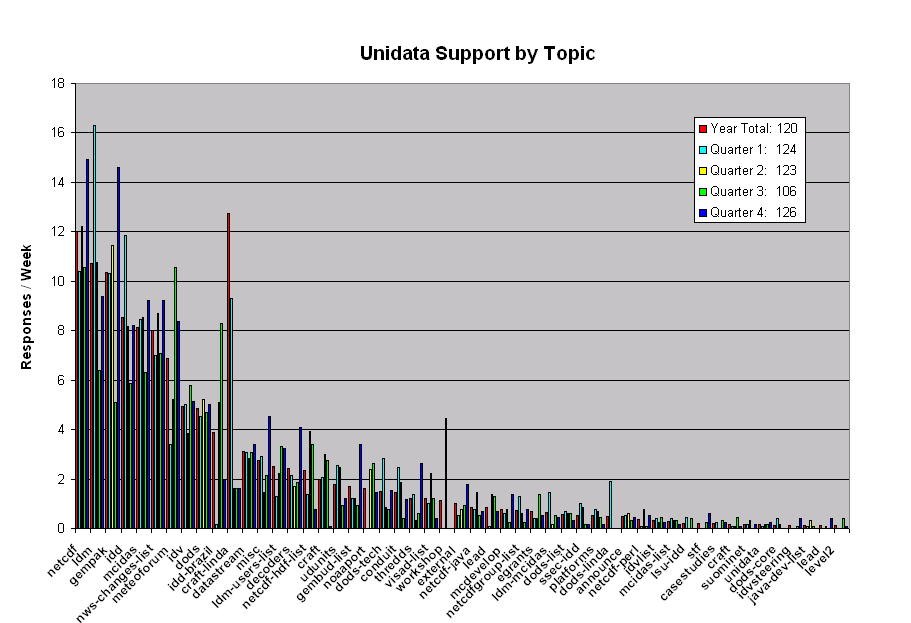
Above are histograms that portray the number of Unidata email
responses for individual topics of support for a one year period
ending May 14, 2004. The histograms are arranged by yearly
activity averages with the highest on the left and lowest on the
right. Each quarter year within the period is depicted from oldest to
newest from left to right. The number of responses has been normalized
to weekly averages so that the support load over the various periods
can be easily compared.
Total support averaged 120 responses/week over the entire year; 124 for
the first quarter; 123 for the second quarter; 106 for the third
quarter; and 126 for the current quarter.
Some tentative conclusions
- The total support load for the UPC remains high and varies seasonally.
- Support required for the legacy visualization packages (GEMPAK, McIDAS)
continues to be substantial.
- Support required for LDM, IDD, and data continues to grow slowly
but shows variability throughout the year.
- Support for netCDF and outreach remains high.
- Taken as a whole, the support required for visualization packages
(GEMPAK, IDV, and McIDAS) is comparable to the support required
to receive data (LDM, IDD).
- Support for any package increases after a new version of the package
is made available.
NOTE
These numbers and conclusions should not be taken too literally, for
several reasons:
- For some packages, multiple responses in the same thread may be
bundled into a single archived email. Other packages have each
response in a thread counted separately.
- After a new release of software, there may be a flurry of the same
or similar questions, which can be answered in separate emails or in
a single mailing list posting.
- This counts primarily support of end users and site administrators,
not developers. Support for other developers in projects such as
OPeNDAP/DODS, THREDDS, McIDAS, GEMPAK, and IDV requires significant
resources, but is difficult to assess.
- Not all support records were indexable for this report. Given this,
the above numbers are an underestimate of the
actual support being provided by the UPC.