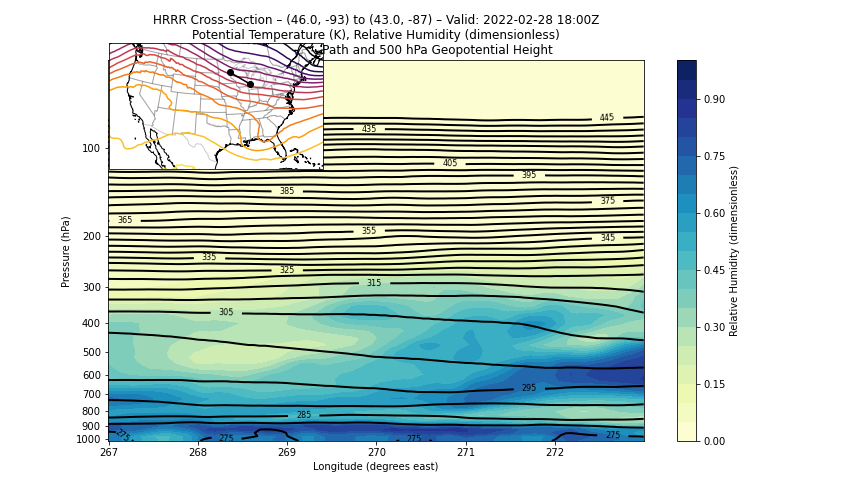
Hello, and thanks for reaching out!

First off, thanks for your patience. After realizing that a.) I never attached
an example to my previous response and b.) my attached response wasn't actually
correct itself, I've spent some time sorting this out properly! Thanks for also
reaching out to us on GitHub, I'll be sure to post a response there in case it
helps others. You are very close, so here's just a few things to get it across
the line!

The most important thing here is that your coordinates and the projection you
are using must pair up. For example, in my original response, I was using some
HRRR data we have here that's "pre-massaged", and I didn't realize that my
projection definition wouldn't work in all cases, even if I had provided it for
you. In that vein, I was able to dig up the operational HRRR namelist (link:
https://rapidrefresh.noaa.gov/hrrr/HRRR/static/HRRRv1/) and make sure to define
my projection correctly. You seem to have relied on these same grid
definitions, as you had these values in your provided sample code (thanks!) The
main thing you were missing there was that the 'x' and 'y' coordinates are
*offset* according to a reference value at the middle (origin), ie if you
reindex your 'x' and 'y' to be centered around this origin, then your
coordinates will line up with your projection and all should be right with the
world. This could potentially also be accomplished by re-defining the proje
 ction appropriately, but that's less of my expertise. That's basically all
that was missing, and I double-checked by plotting and comparing with the
original attached latitude and longitude.

I went ahead and provided a few extra shortcuts we can help you with using
MetPy and commented them appropriately, so check out the attached code and see
if things work correctly this time. I also removed some unnecessary steps, like
re-attaching the latitudes and longitudes. If you have any questions about the
specifics, please follow up. Thanks again, and I hope this helps!


All the best,

Drew


> Following up on this....I'm back on the hunt of trying to plot a HRRR cross
> section using the metpy cross function.
> I'm close!
> I still think I'm missing something very obvious if you can take a peak and
> give some advice or hints where to look.

Ticket Details
===================
Ticket ID: CUJ-578004
Department: Support Python
Priority: Low
Status: Closed
===================
NOTE: All email exchanges with Unidata User Support are recorded in the Unidata
inquiry tracking system and then made publicly available through the web.  If
you do not want to have your interactions made available in this way, you must
let us know in each email you send to us.
import cartopy.crs as ccrs
import cartopy.feature as cfeature
import matplotlib.pyplot as plt
import metpy.calc as mpcalc
import numpy as np
import xarray as xr
from metpy.interpolate import cross_section

# your provided data, thanks!
ds = xr.open_dataset("hrrr-02-28-2021-pres.nc").squeeze()

# provided 'mb' will parse as 'millibarns'
ds["plevel"].attrs["units"] = "hPa"

# from namelist
ref_lat = 38.5
ref_lon = -97.5
truelat1 = 38.5
truelat2 = 38.5
stand_lon = -97.5

# these are where the headache came in
ref_x = 900
ref_y = 530

# manually assign crs
ds = ds.metpy.assign_crs(
    grid_mapping_name="lambert_conformal_conic",
    latitude_of_projection_origin=ref_lat,
    longitude_of_central_meridian=ref_lon,
    standard_parallel=[truelat1, truelat2],
    earth_radius=6371229.0,
)

# remember to adjust for python indexing!
# this will zero-center your coordinates appropriately
ds["x"] = ds["x"] - ds["x"][ref_x - 1]
ds["y"] = ds["y"] - ds["y"][ref_y - 1]

# let's make the cross section!
start = (46.0, -93)
end = (43.0, -87)

cross = cross_section(ds, start, end)

cross["Potential_temperature"] = mpcalc.potential_temperature(
    cross["plevel"], cross["TMP"]
)

# we can sprinkle in some of MetPy's unit conversion magic here!
# with some extra steps, this will be a bit more robust and
# preserve and attach the new unit information appropriately
cross["Relative_humidity"] = cross["RH"].metpy.convert_units("dimensionless")
cross["Omega"] = cross["VVEL"].metpy.convert_units("hPa/s")
cross = cross.drop_vars(["RH", "VVEL"])

## and we can re-xarray-ify everything (and ditch the custom CRS coordinate)
## to save our cross section out to a netcdf with our changes!
# cross.metpy.dequantify().drop_vars('metpy_crs').to_netcdf('cross_section.nc')

# the rest is mostly unchanged!
# Define the figure object and primary axes
fig = plt.figure(1, figsize=(12.0, 7.0))
ax = plt.axes()

# Plot RH using contourf
rh_contour = ax.contourf(
    cross["longitude"],
    cross["plevel"],
    cross["Relative_humidity"],
    levels=np.arange(0, 1.05, 0.05),
    cmap="YlGnBu",
)
rh_colorbar = fig.colorbar(rh_contour)

# Plot potential temperature using contour, with some custom labeling
theta_contour = ax.contour(
    cross["longitude"],
    cross["plevel"],
    cross["Potential_temperature"],
    levels=np.arange(250, 450, 5),
    colors="k",
    linewidths=2,
)
theta_contour.clabel(
    theta_contour.levels[1::2],
    fontsize=8,
    colors="k",
    inline=1,
    inline_spacing=8,
    fmt="%i",
    rightside_up=True,
    use_clabeltext=True,
)

# Adjust the y-axis to be logarithmic
ax.set_yscale("symlog")
ax.set_yticklabels(np.arange(1000, 50, -100))
ax.set_ylim(cross["plevel"].max(), cross["plevel"].min())
ax.set_yticks(np.arange(1000, 50, -100))

# Define the CRS and inset axes
# you may need to play around with the inset location
data_crs = ds["HGT"].metpy.cartopy_crs
ax_inset = fig.add_axes([0.125, 0.665, 0.25, 0.25], projection=data_crs)

# Plot geopotential height at 500 hPa using xarray's contour wrapper
ax_inset.contour(
    ds["x"],
    ds["y"],
    ds["HGT"].sel(plevel=500.0),
    levels=np.arange(5100, 6000, 60),
    cmap="inferno",
)

# Plot the path of the cross section
endpoints = data_crs.transform_points(
    ccrs.Geodetic(), *np.vstack([start, end]).transpose()[::-1]
)
ax_inset.scatter(endpoints[:, 0], endpoints[:, 1], c="k", zorder=2)
ax_inset.plot(cross["x"], cross["y"], c="k", zorder=2)

# Add geographic features
ax_inset.coastlines()
ax_inset.add_feature(
    cfeature.STATES.with_scale("50m"), edgecolor="k", alpha=0.2, zorder=0
)

# Set the titles and axes labels
ax_inset.set_title("")
ax.set_title(
    f"HRRR Cross-Section \u2013 {start} to {end} \u2013 "
    f'Valid: {cross["time"].dt.strftime("%Y-%m-%d %H:%MZ").item()}\n'
    "Potential Temperature (K), Relative Humidity "
    "(dimensionless)\nInset: Cross-Section Path and 500 hPa Geopotential Height"
)
ax.set_ylabel("Pressure (hPa)")
ax.set_xlabel("Longitude (degrees east)")
rh_colorbar.set_label("Relative Humidity (dimensionless)")

fig.savefig("hrrr_cross_section.png")
Attachment:
hrrr_cross_section.png
Description: PNG image