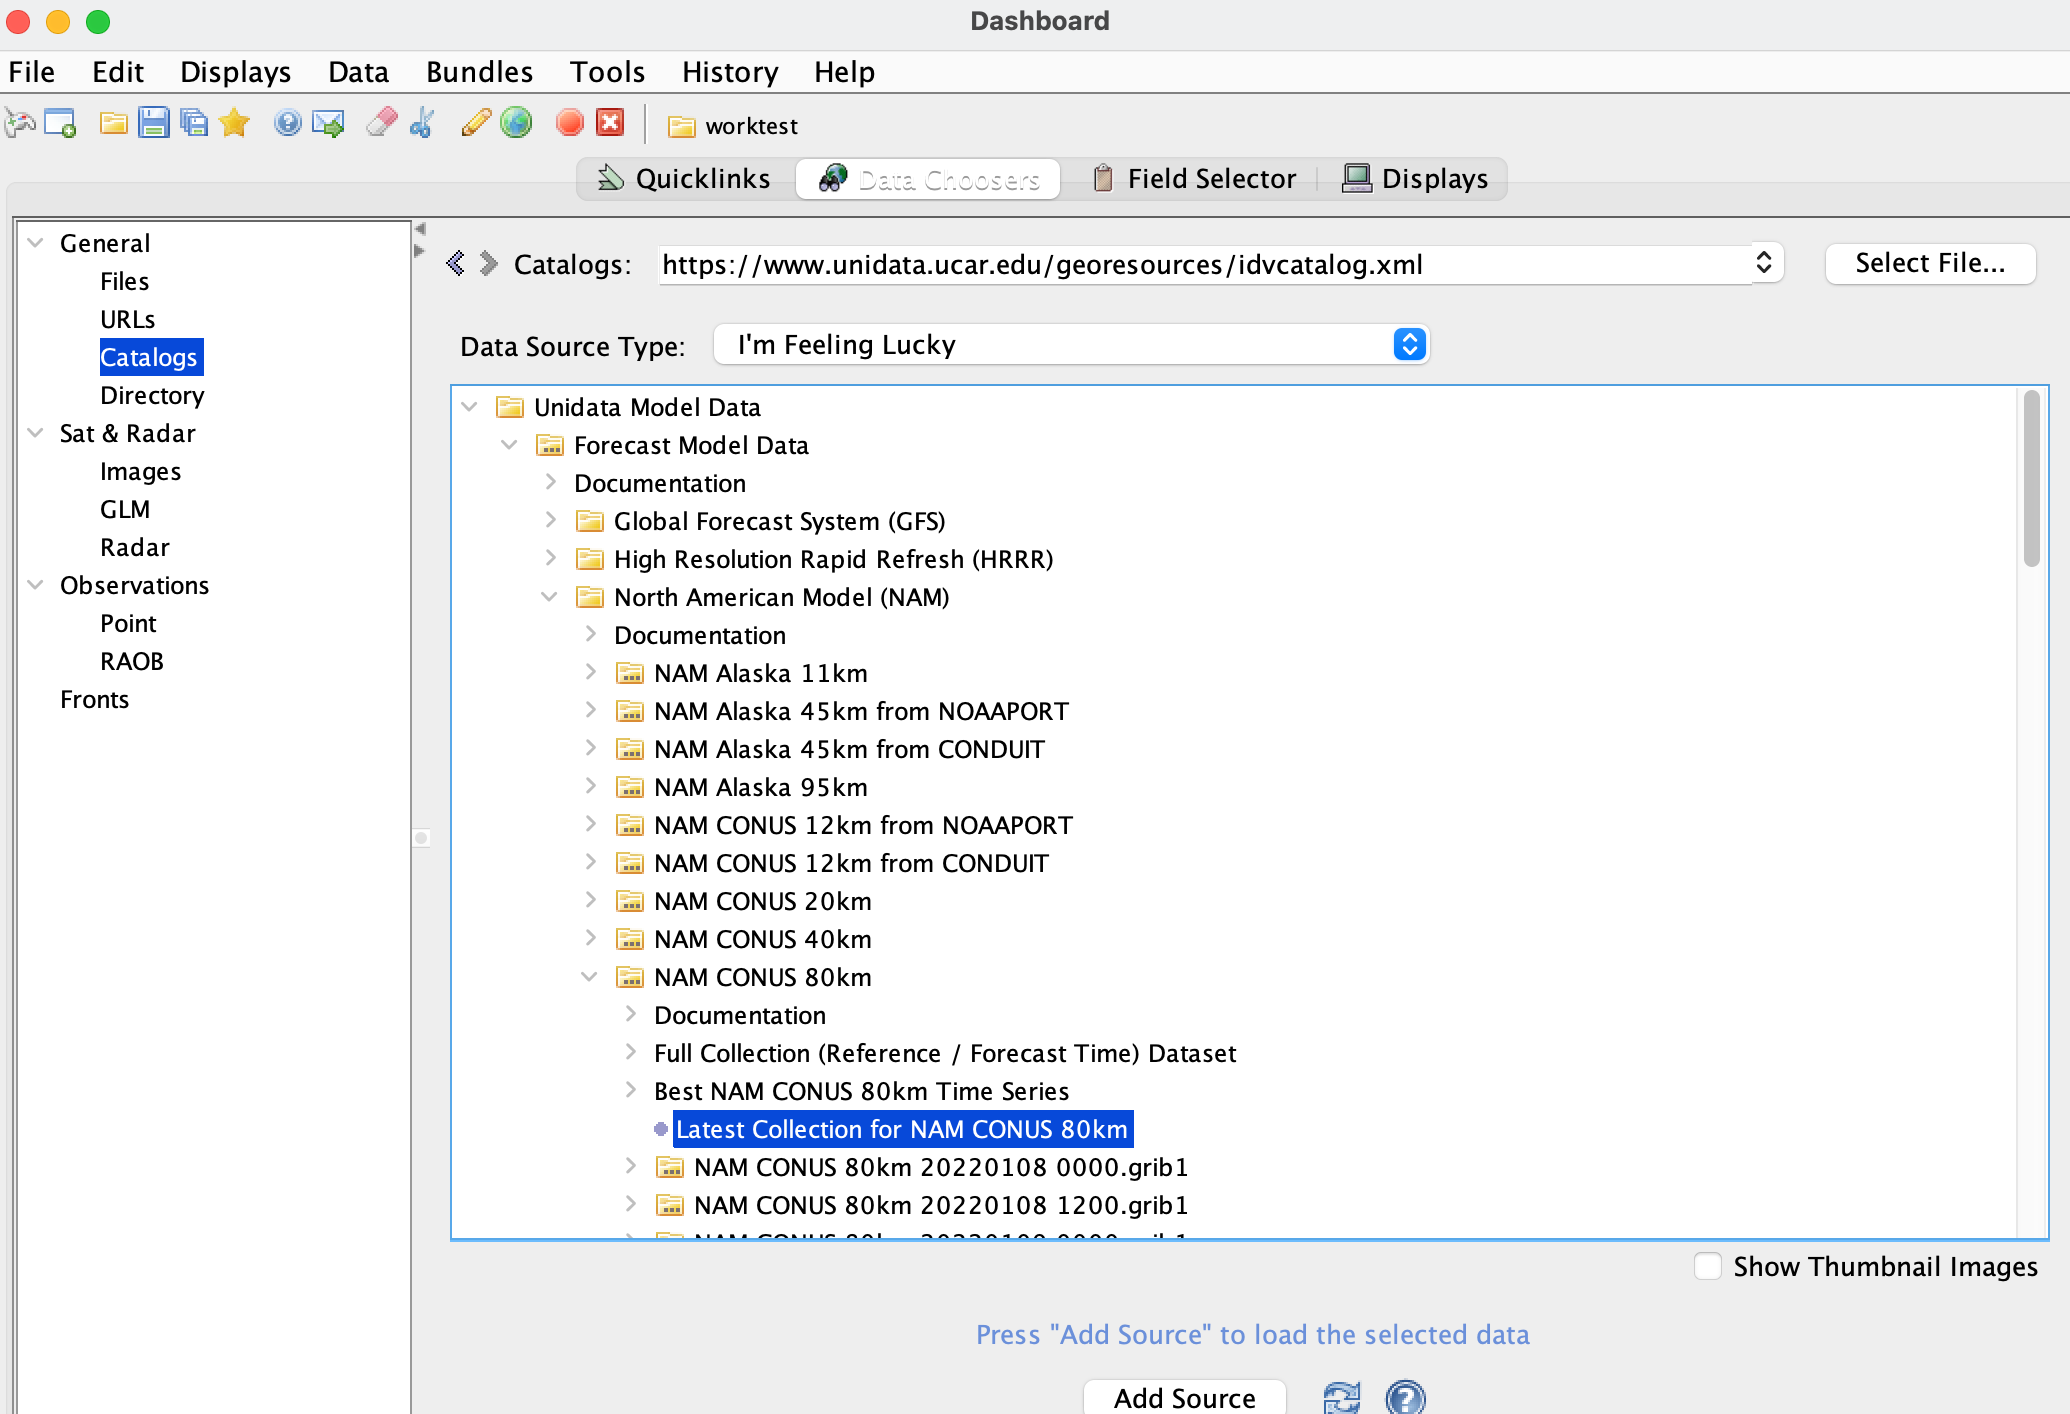
> Full Name: Paula
> Email Address: address@hidden
> Organization: Universitat de Barcelona - STUDENT
> Package Version: 6.0u1 build date:2021-07-29 17:09 UTC
> Operating System: Windows 10
> Hardware: Java: home: C:\Program Files\IDV_6.0u1\jre version: 1.8.0_282
> j3d:1.6.1 fcs fcs
> Description of problem: Good morning,
> I am having some trouble with some of the sections from the Workshop.
> Although I follow the exact steps given in the Workshop, there are a few
> displays I still cannot create.
>
> 3.2.11 Grid Isentropic Analysis
> 1) I cannot represent the isentropic topography display. I follow the steps
> detailed in the Workshop: Data Chooser> Files node> sample_eta_grid.nc //
> Fields > 3D grid node > Derived node>Potential Temperature IsoSurface //
> Displays > Constant Theta Surface Height Plan View node > Isentropic
> Topography > Create Display // Dialog (to set the isosurface value) > 310 >
> OK.
> When I click on the Create Display button, the background map remains
> unchanged.
>
> 2) Using the same data source. Fields > 3D grid node > Derived node >
> Potential Temperature IsoSurface Scalar Analysis // Displays > 3D Theta
> Surface node > Contours Over Constant Theta Surface > Create Display //
> Dialog (to set the isosurface value) > 310.5 // Dialog (to select the
> parameter field) > 3D grid > temperature (since the option
> Temperature@Isobaric surface does not appear) > OK.
> I do not know if it is relevant to select temperature instead of
> Temperature@Isobaric surface, but I get the contours displayed.
>
> 3) Also using the same data source. Fields > 3D grid node > Derived node >
> Potential Temperature IsoSurface Vector Analysis // Displays > Constant Theta
> Surface Flow Displays node > Vectors Colored by Speed over Theta Surface >
> Create Display //Dialog (to set the isosurface value) > 310.5 > OK // Dialog
> (to select the vector field) > 3D grid node > Derived node > True Wind
> Vectors (from GridRelative_u & GridRelative_v) > OK.
> When I click on the Create Display button, the background map remains
> unchanged. Nothing is added in the view window.
>
> How could I fix all these to get de displays? May it be any plugin missing?
>
> Thank you in advance.
>
> Paula
>
>
>
Hi Paula,

I can reproduce your problem and it is likely the vertical coordinate unit of
the old sample file can not be
parsed correctly. However, you can use other real-time data from the thredds
data server (attached image)
and practice these grid isentropic analyses.


Yuan


Ticket Details
===================
Ticket ID: BBP-845792
Department: Support IDV
Priority: Normal
Status: Open
===================
NOTE: All email exchanges with Unidata User Support are recorded in the Unidata
inquiry tracking system and then made publicly available through the web.  If
you do not want to have your interactions made available in this way, you must
let us know in each email you send to us.
Attachment:
Screen Shot 2022-02-07 at 8.21.37 PM.png
Description: PNG image