Unidata IDV Workshop for version 6.2u2 > Accessing and Displaying Data > Working with WRF Output > Jython

3.13.1.2 Contours
How to extend the basic display of WRF data to change the default contour characteristics.
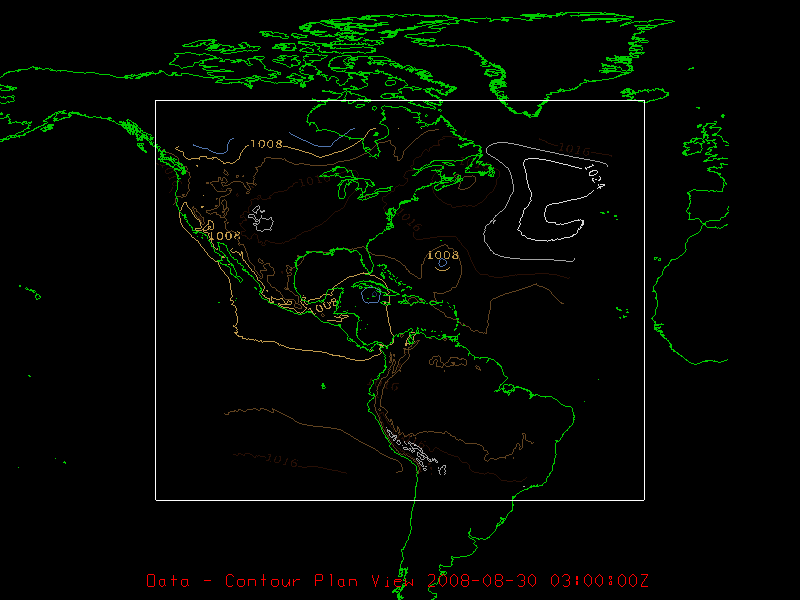
Let's start off by examining how to change the color of the contours on our image. There are two basic coloring schemes that we can use to do this — use a range of colors from a colormap in which the value of the isoline is reflected by color, or use one solid color, although both will be done in the same way. The first thing we must do is ask the IDV to give us access to the available color table resources. To do this, we must get the current ColorTableManager from the main idv instance idv (see DefaultIDV for more information). Once we have the ColorTableManager, we can set a new color table for our display. Note that for the built-in colortables, the name comes from the name property of the ColorTable object, which can be found in two locations: colortables.xml and extra.xml. These can also been seen from within the IDV using the Color Table Editor. If you've installed other color tables via plug-ins (or created your own), then going through the Color Table Editor is the best way to see a list of the available names. For our example plotting MSL Pressure, the IDV default color table is "PressureMSL". Let's change that to the "TOPO/Sat Composite" color table, just for fun.
filename = './wrfprs_d01.060'
file_opener = 'file.grid'
ds = makeDataSource(filename, file_opener)
variable = 'Pressure_reduced_to_MSL @ msl'
display_type = 'planviewcontour'
image_dimensions = (800, 600)
output_name = 'contour2D.png'
setOffScreen(1)
idv.getStateManager().setViewSize(java.awt.Dimension(image_dimensions[0], image_dimensions[1]))
pressure = getData(ds.getName(), variable)
dc = createDisplay(display_type, pressure)
ctm = idv.getColorTableManager()
dc.setColorTable(ctm.getColorTable('TOPO/Sat Composite'))
old_unit = dc.getDisplayUnit()
dc.setDisplayUnitName('mb')
new_range = dc.convertColorRange(dc.getRange(),old_unit)
dc.setRange(new_range)
pause()
image = getImage()
writeImage(output_name)
|
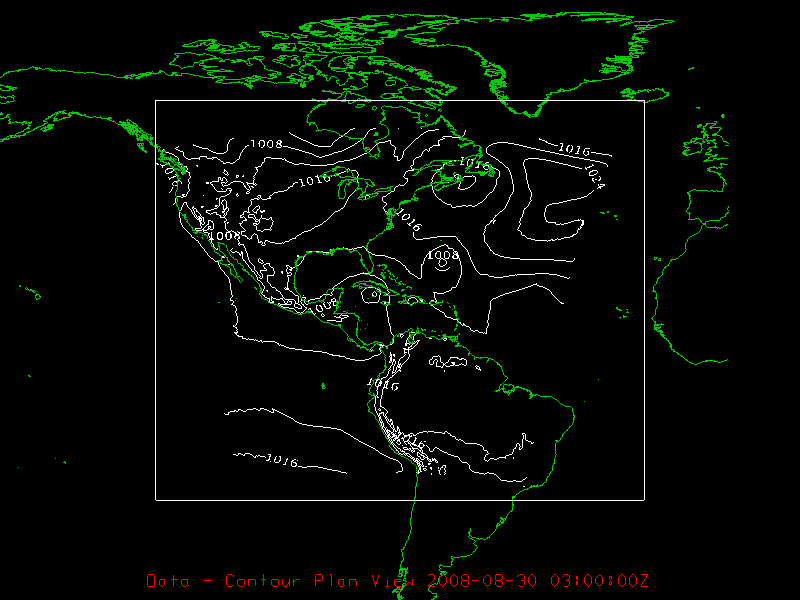
If we would rather have a solid color, say white, then use the Color Table name "white":
filename = './wrfprs_d01.060'
file_opener = 'file.grid'
ds = makeDataSource(filename, file_opener)
variable = 'Pressure_reduced_to_MSL @ msl'
display_type = 'planviewcontour'
image_dimensions = (800, 600)
output_name = 'contour2D.png'
setOffScreen(1)
idv.getStateManager().setViewSize(java.awt.Dimension(image_dimensions[0], image_dimensions[1]))
pressure = getData(ds.getName(), variable)
dc = createDisplay(display_type, pressure)
ctm = idv.getColorTableManager()
dc.setColorTable(ctm.getColorTable('White'))
old_unit = dc.getDisplayUnit()
dc.setDisplayUnitName('mb')
new_range = dc.convertColorRange(dc.getRange(),old_unit)
dc.setRange(new_range)
pause()
image = getImage()
writeImage(output_name)
|
If you would like to change the contour interval from the default (4 mb in our example) to a new interval (let's go with 2 mb), simply do the following:
filename = './wrfprs_d01.060'
file_opener = 'file.grid'
ds = makeDataSource(filename, file_opener)
variable = 'Pressure_reduced_to_MSL @ msl'
display_type = 'planviewcontour'
image_dimensions = (800, 600)
output_name = 'contour2D.png'
setOffScreen(1)
idv.getStateManager().setViewSize(java.awt.Dimension(image_dimensions[0], image_dimensions[1]))
pressure = getData(ds.getName(), variable)
dc = createDisplay(display_type, pressure)
ctm = idv.getColorTableManager()
dc.setColorTable(ctm.getColorTable('White'))
old_unit = dc.getDisplayUnit()
dc.setDisplayUnitName('mb')
new_range = dc.convertColorRange(dc.getRange(),old_unit)
dc.setRange(new_range)
cinfo=dc.getContourInfo()
cinfo.setInterval(2.0)
dc.setContourInfo(cinfo)
pause()
image = getImage()
writeImage(output_name)
|
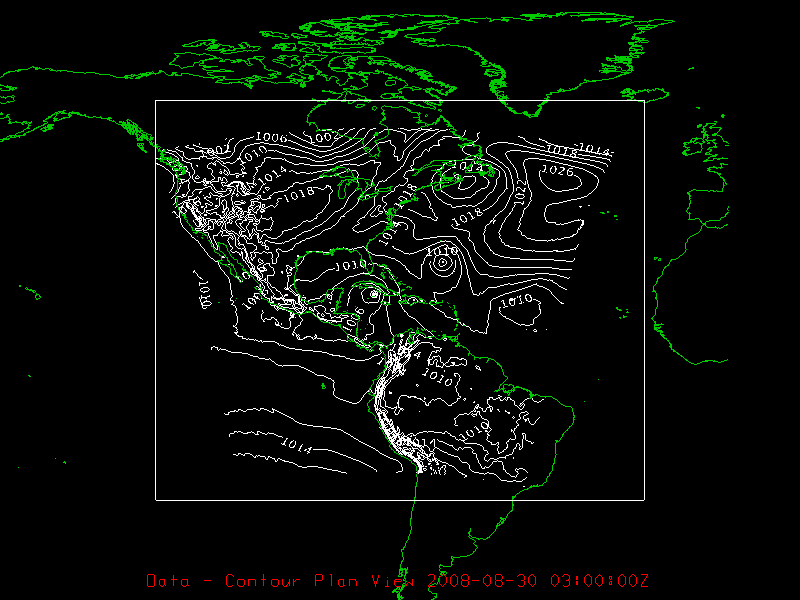
Note that the variable cinfo contains the various properties for the contours, including turing on/off labels, font type, dash style, alignment, etc. For more information on the methods that can be used to change the contour properties through the cinfo variable, see the JavaDoc for ControurInfo.
Unidata IDV Workshop for version 6.2u2 > Accessing and Displaying Data > Working with WRF Output > Jython