If you have participated in the WRF tutorial, then you are likely familiar with the output from the Hurricane Gustav simulation, which is what we will use in this tutorial. These data are on the thumb drive you received as part of the workshop, although any WRF post-processed output should do fine. While the IDV can handel the staggered grids produced by WRF, it's highly recommended that you:
- post process the raw output to get your data on a non-staggered grid.
- use netCDF or grib output.
While the IDV can handle staggered grids, it's a large performance hit to let the IDV de-stagger themfor you on the fly when performing calculations.
The first step in using the IDV for visualization and analysis is to get your data into the the IDV environment, which is the focus of the first section of this tutorial.
The IDV GUI has two main windows: the Dashboard and the View Window. The View Window is where you will see and manipulate displays you create. The Dashboard is where you will be able to load your data and easily access all controls for manipulating the properties of variables you wish to display (like setting contour properties, adding color scales, changing color tables, etc). In order to get your WRF output into the IDV from the GUI interface, you will need to start the IDV and go to the Dashboard.
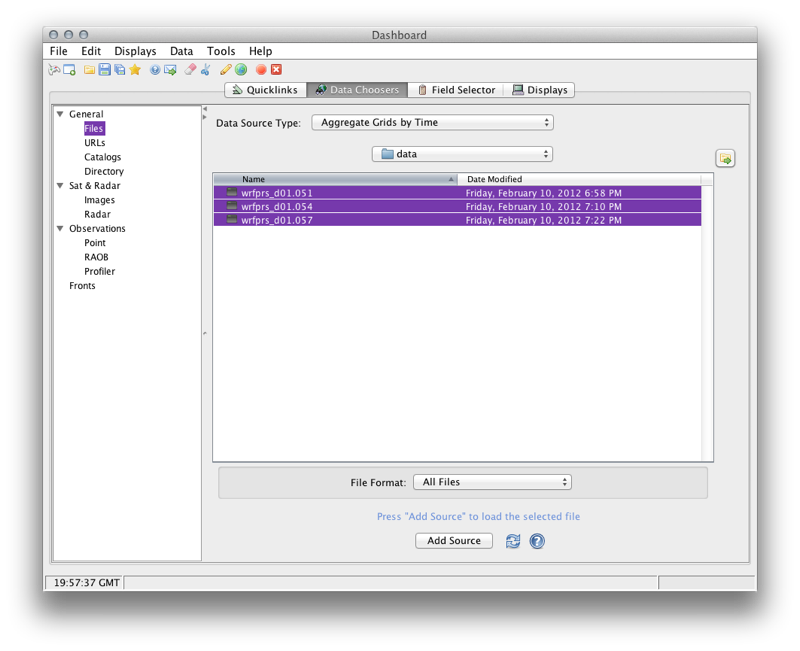
The display above shows the Dashboard window of the IDV. The Data Choosers tab has been selected, and we are going to directly load files off of our computer (note Files under General is selected on the left hand side of the Dashboard). Follow these steps to begin the process of loading your data into the IDV.
- Locate your WRF output in the file browser and select the files you wish to load (hold shift to select multiple files).
- Make sure that
Data Source Typeis set toAggregate Grids by Time. - Click
Add Source.
Once you click Add Source, the IDV will switch you from the Data Choosers tab to the Field Selector tab.
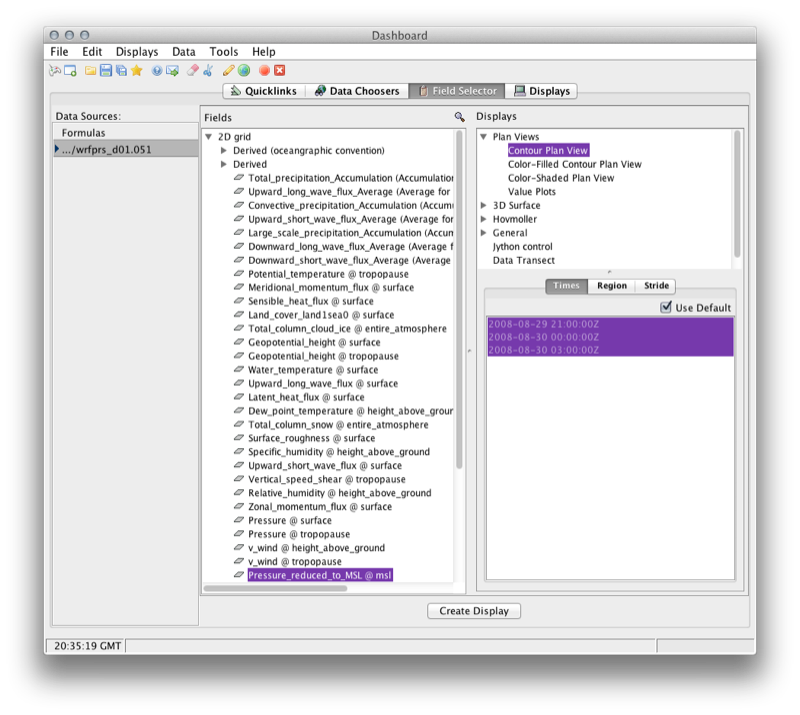
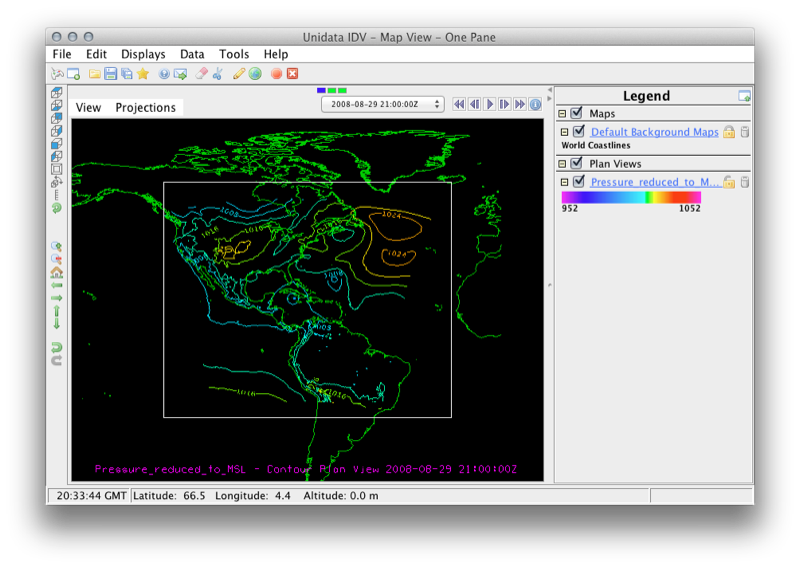
The Field Selector tab is where you will select the fields to analyze and types of images to generate. In the screenshot above, the 2D field Pressure_reduced_to_MSL @ msl (list on left side of the Field Selector tab) has been selected, and a display type Plan Views→Contour Plan View (list on top right side of the Field Selector tab) has been chosen. For now, we will leave spatial and temporal subsetting as default (i.e. no subsetting) and load the entire grid. For more information on subsetting, see the Field Selector page. The final step is to push the Create Display button.
Note: up until this point, very little information has been loaded off of your disk into memory. Once you press the Create Display button, data for the field you selected will be read off of disk - depending on the size of your data set, this may take quite some time!
Once the data has been loaded, the IDV will generate an image in the View Window. Congratulations, you've just loaded your WRF data into the IDV! Next, let's explore how to save images and generate animations using the IDV.