Unidata's Integrated Data Viewer

2 Getting Started
This section describes how to quickly get started using the IDV and
making displays of common data available through the IDV. It is not
intended to be a complete tutorial. For a more detailed guide to
IDV usage, see the
Unidata IDV Training Workshop material.
IDV Main Windows
There are two main windows in the IDV reference application -
- the Dashboard window and the Main Display window.
Other windows may appear when needed.
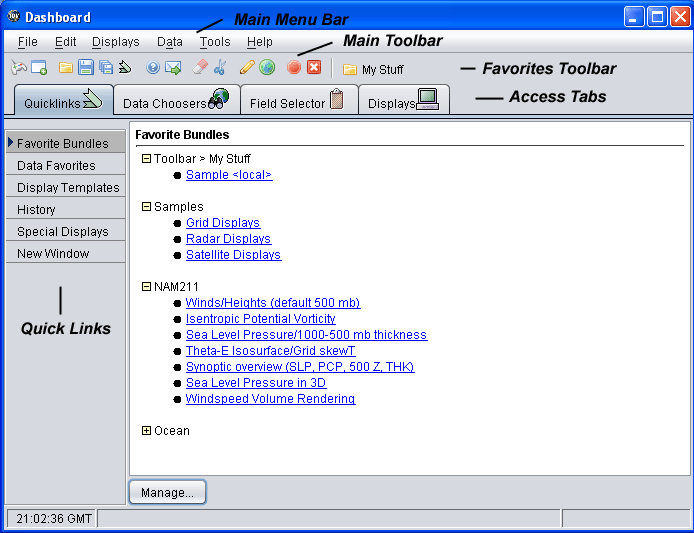
Dashboard
The Dashboard window is central to the IDV. You use it to choose
among data sources and parameters to display, choose the kinds of displays
to make, and choose times of data to display.
Information on the use of this window can be found
in the Dashboard section.
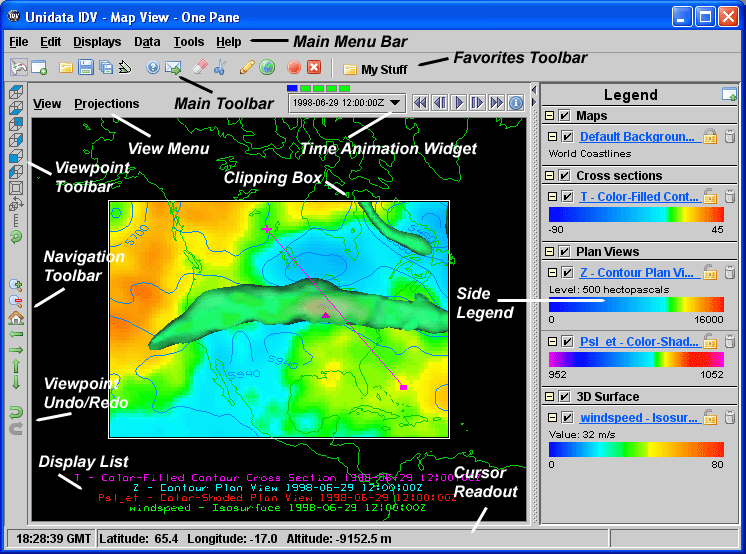
View Window
The View Window or view manager window includes
many of the IDV displays, the legends, time animation controls,
view point controls for 3D displays, icons to zoom and pan, menus of
maps, and the main IDV menu. All these features have sections
throughout the user guide.
Common Usage Scenario
To create displays with the IDV, the common usage scenario is:
Getting Started Sections
Learning more
Review the material about
Choosing Data Sources,
Selecting Data Parameters and Displays,
and the Main Menu to learn more
about data selection and making displays.
The Available Data Sources
page lists the different data sets available for the IDV.
Unidata's Integrated Data Viewer