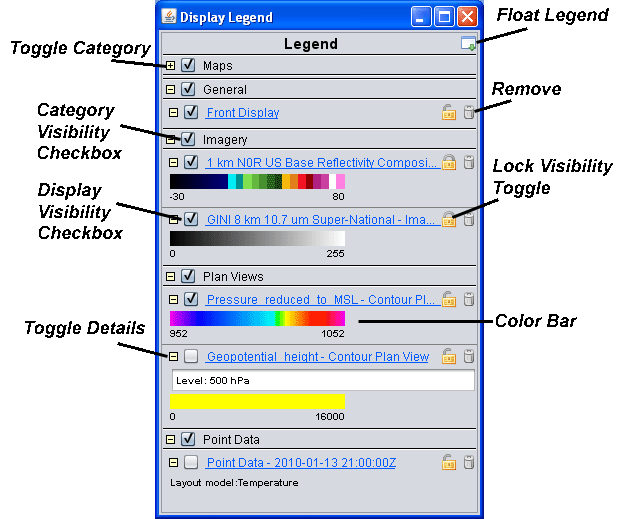
Image 1: Side Legend


Float Window button.

The legend shows each display under the "display category" of that display. For example, the legend in the above image shows the categories "Maps", "General", "Imagery", "Plan Views" and "Point Data". The display category may be changed (see below). This is useful for grouping and controlling the visibility of a group of displays.
The legend label shows the parameter or field name, the display type,
and sometimes other information such as the level of a plan view or
value of an isosurface. The label may be changed by a user using items
under the Edit->Properties menu item (described below).
Clicking on the highlighted part of the label will bring up the displays
control window. Right clicking will bring up the displays control menu.
The category display within the legend can be toggled to show or
hide the displays under that category with the
Toggle Category button. The details of a
display can also be toggled with the
Toggle Details button. The visibility of the displays under
a category (i.e., the graphical display within the main view window)
can be changed with the Category Visibility Checkbox. The
visibility of an individual display can be changed with the
Display Visibility Checkbox
The Remove button allows you to quickly remove a display.
The Lock Visibility Toggle allows you to "lock"
the current visibility of the display and not change it while doing the
visibility cycling.
Detailed information about a display may also be shown in the legend. For example, for those displays that use a color table, the color bar will also be shown in the legend. Moving the mouse over the color bar shows intermediate values. Click on the color bar to get a Color Table Editor with the color table for that display.
 to drop it onto one of the View labels
to also change the View. Within the legend you can also drag label
onto another Category label to change the display category.
The File menu has these common choices:
Remove Display
Save
Save Data in Cache
Save As Parameter Defaults
Save Display as Favorite
Save Display as Bundle
Reload Data
Close Window
Edit menu has these common choices:
Color Table
Selector Color, et. al.
Change Parameter
Change Display Unit
Change Contours
Sharing
Properties
View menu has these common choices:
Visible
Lock Visibility
Bring to Front
Show View Window
Use Times in Animation
Times
Use Times in Animation
Drive Times with this Display
Uses Time Driver Times
Display List
Use Data Projection
Enable Adaptive Resolution
Match Display Region
Help menu has these common choices:
Details
User's Guide
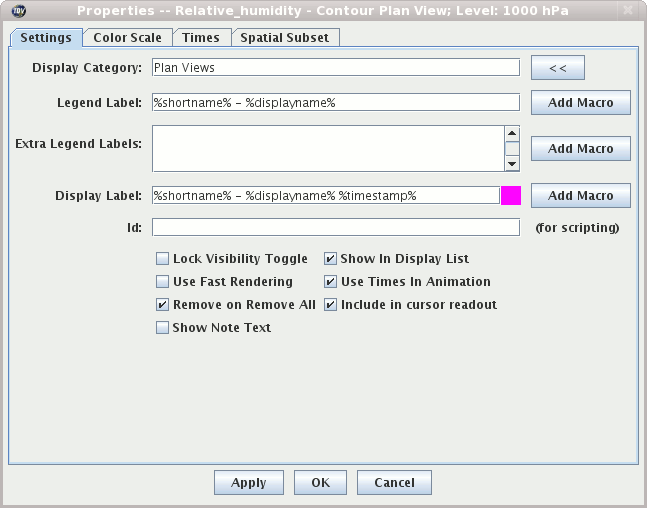
Edit->Properties menu:

Display Category field is arbitrary text and is
used to organize
the legend. The "<<" button shows a list of all of the
current display categories and allows you to easily set this field.
The Legend Label field is the label used in the legend of
this display control. It can contain arbitrary text as well
as a set of "macros". The macros can be added
to the label with the Add Macro button:
Short Name This is the short name of the parameter being displayed.
Long Name This is the long name of the parameter being displayed.
Data Source Name This is the name of the data source that produced
the parameter being displayed.
Display Name The name of the display.
Timestamp The time of the data that is currently being displayed using the default time format preference.
You can also use a macro of the form %time:<time pattern>% to
set a specific time format other than the default. <time pattern>
follows the same rules defined in the
User Preferences section. For example,
%time:HHz EEE dd MMM yyyy% would give something like
12GMT Fri 16 Feb 2007.
... And other values depending on the display.
The Extra Legend Labels field acts like the Legend Label field (e.g., with macros).
The Display Label field acts like the Legend Label field
to define the text label that is shown in the display list. The color swatch
shows the current color for the labeld. Clicking on it brings up a color
menu that can be used to change the color of the label.
The Id field is used to define an ID for this display. The ID is
used for accessing particular displays from the
IDV Scripting Language.
There may be a variety of check boxes:
Show In Display List
Allows you to toggle the visibility of the label in the view window.
Note that you must enable showing the list of display labels
that are toggled on using the View->Properties dialog
of the view window, or by setting the global property for
all display through the User
Preferences dialog.
Lock Visibility Toggle Locks/unlocks
visibility toggling.
Show Note Text
Arbitrary text notes can be added to a
display. This checkbox menu item shows or hides the text field
that allows you to edit the notes.
Use Fast Rendering
When this is checked on, the IDV will
not try to account for projection seams. This will cause displays to
be rendered faster at the expense of accuracy.
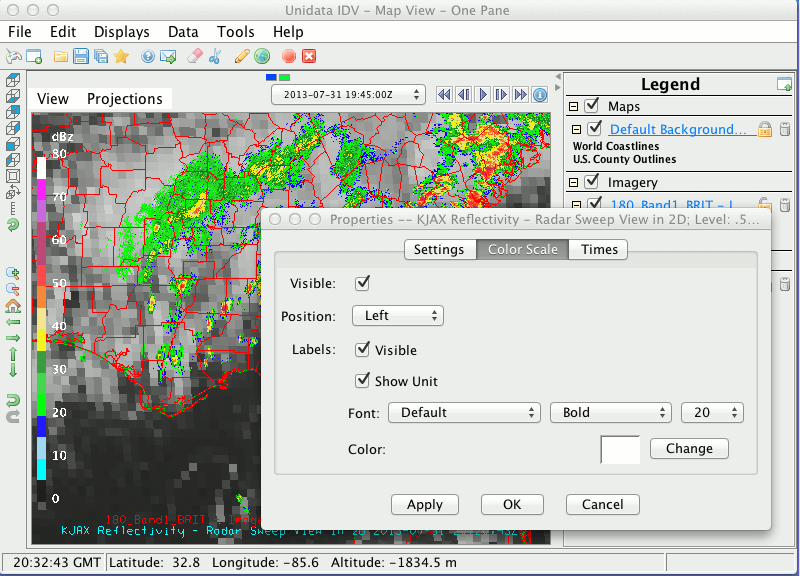
There may be other tabs shown, depending on the display. For example,
the Color Scale tab allows you to configure where the color scale
bar is shown (see below). The Spatial Subset tab allows
you to change the spatial subsetting of the data.
Color Scale tab to configure the positioning and labelling
of the color scale.

Display Visibility checkbox to the left
of the label can be used to toggle the visibility of that display.
F1, F2, F3* can
be used to cycle visibility as follows:
F1 key cycles visibility through
all non-locked displays, showing one at a time.F2 turns on all non-locked
displays.F3 turns off all non-locked
displays. on the right
side of the
 Legend is used to block the effects of
the visibility toggling described above. When locked the visibility of
a display is not affected by the toggling.
View->Visible checkbox
menu item in each display control's menu.