Scenario: ASCII Data from a Variety of Instruments (PECAN Field Study)
Tools at a Glance
Back to Scenarios
This case study describes an experiment that gathered data from
a range of atmospheric sensors, collected mostly in ASCII format.
Data files are converted to netCDF format using Unidata's Rosetta
data transformation tool, and data are made available using
Geode Systems' RAMADDA data server.
Project Background
A team at Millersville University, led by PI Dr. Richard
Clark, particpated in the regional PECAN
(Plains Elevated Convection at Night) study during 2015.
PECAN is a large project, involving eight research
laboratories and fourteen universities with funding from the
National Science Foundation (NSF), the National Center for
Atmospheric Research's Earth Observing Laboratory (EOL), and
the National Oceanic and Atmospheric Association (NOAA).
PECAN aims to gain insight into the evolution of nocturnal
Mesoscale Convective Systems (MCS's) that are often
ill-detected and quite damaging in the plains region.
Additionally, researchers at Millersville also hoped to
gain a more thorough understanding of the Great Plains Low Level Jet.
Data collected as part of the PECAN project are governed
by the PECAN Data Policy.
Read more about this project on the News@Unidata blog.
Data Collected
The PECAN study took place from June 1st through July 15th,
with the majority of observational sites in Kansas, but also
in the adjacent parts of Oklahoma, Nebraska, and Texas.
Millersville employed six instrument platforms, including a
radiosonde, a tethersonde, an acoustic SODAR known as a
radio acoustic sound system (RASS), a MPL111 LIDAR, and a 10
meter tower that took standard surface measurements and was
also equipped with two CSAT-3 sonic anemometers.
The radiosonde and tethersonde equipment generate ASCII text
files, which are run through a small python program to
create an image file in png format of a skew T-log p
diagram. The radiosonde also creates a text file (EDT file
format) reporting the thermodynamic and wind mandatory and
significant levels.
The micropulse MPL111 LIDAR and the radio acoustic SODAR and
RASS data are saved in a proprietary format from which image
files are generated by the signal processing units.
The two CSAT-3 sonic anemometers for determination of variances
and covariances generate ASCII format data files.
Tools Used for Data Processing and Analysis
The raw text files generated by the six instruments were
checked manually by Millersville students for quality assurance,
and then sent to EOL bundled with a READme text file containing
metadata. At EOL, the raw files were converted to one
second data text files and formatted for consistency as
part of the overall PECAN project.
After processing by EOL, the Millersville team used
Unidata's Rosetta data transformation tool to convert
the separate data and metadate text files into CF-compliant
(Climate and Forecast metadata convention) netCDF files.
After the conversion to CF-compliant netCDF, Millersville's research team can use
the data directly in a variety of scientific data analysis programs,
including Unidata's Integrated Data Viewer (IDV). Dr. Clark's team
plans uses the IDV to visualize the observational data in a 3D
graphical environment.
Data Storage Strategy and Tools Used
Afer the quality assurance process is complete, data are:
-
Stored locally on computers attached to Millersville's
own network
-
Forwarded to the PECAN Data Archive Center at EOL for long-term storage
Data Access Strategy and Tools Used
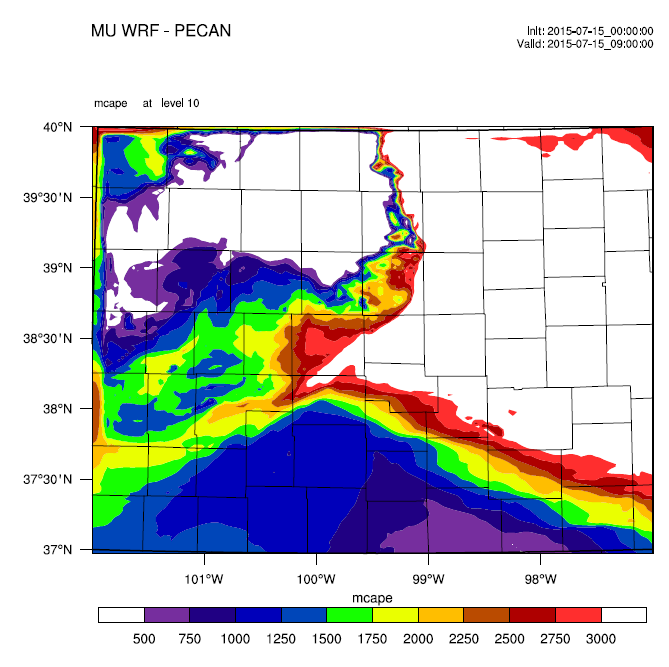
Sample plot of CAPE from MU RAMADDA
(Click to enlarge)
PECAN data are made available by EOL
via the EOL PECAN web site. Access is restricted;
interested users of the data must contact EOL
to acquire login credentials for the project's FTP server.
With proper credentials, users will be able to download
individual datasets for local use.
In addition, Millersville has set
up a RAMADDA server on their own network. Users who access the
data via Millersville's RAMADDA server view or download either
raw WRF output files or plots of derived products. Community
members can access the Millersville RAMMADA server at:
http://ramadda.esci.millersville.edu:8080/repository
The python scripts used to generate radiosonde files and images
are also available on the RAMADDA server.
Data Archiving Stragegy and Tools Used
Long-term archival storage of PECAN data will be managed by EOL
via the EOL PECAN web site.