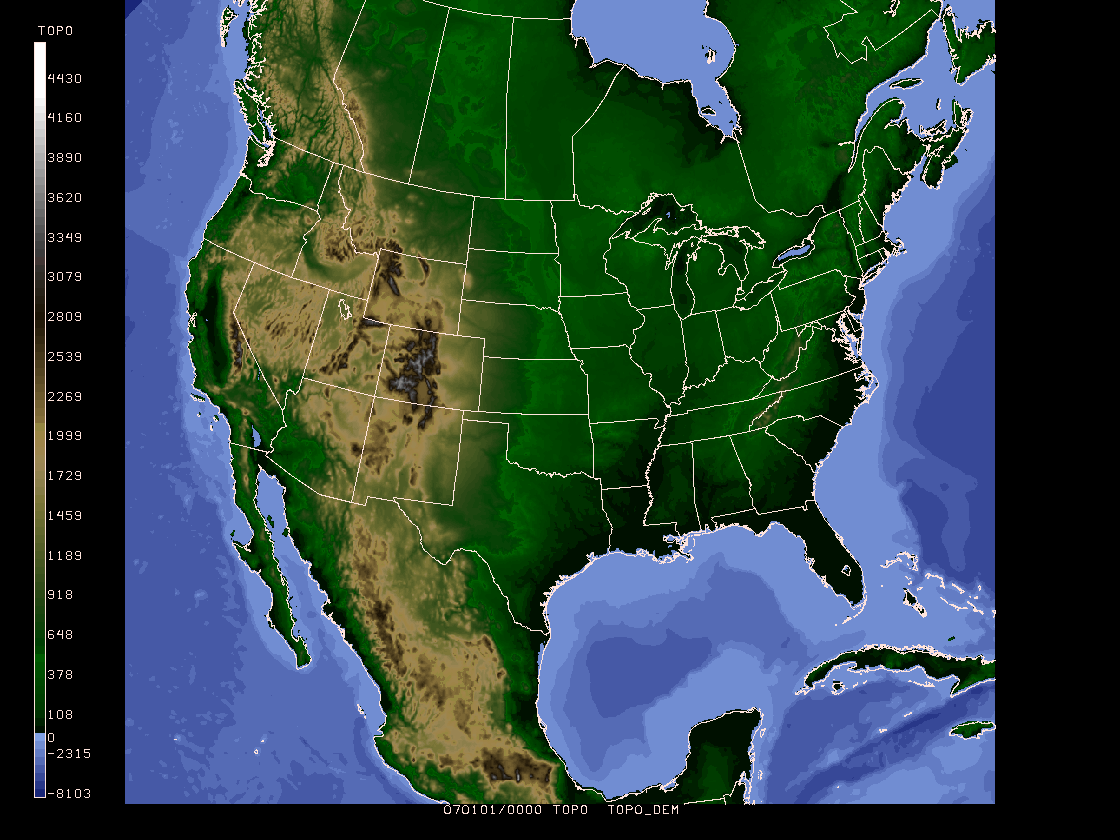
    GDFILE   = nam_basemap.gem
    GAREA    = 10;-140;65;-40
    GDATTIM  = 070101/0000
    GVCORD   = none
    GFUNC    = topo
    TOPOFL   = dem5
    IJSKIP   = 0
    GEMPAK-GDTOPO>r


    GDTOPO PARAMETERS:

    Grid file:       nam_basemap.gem

    Topography file: /home/gempak/GEMPAK5.10.2/gempak/tables/unidata/world_topo.5min

    GAREA:              10;-140;65;-40
    Lower left corner:      10.0000  -140.0000
    Upper right corner:     65.0000   -40.0000

    Number of X/Y grid points:   1200  660
        Number of Grid points:       792000

    Minimum and Maximum values -8103.00  4700.00
- Use a 2 part calibration range for band 3. Use pixel values 0 to 7 for negative values (-8103 to 0 meters), and pixel values 8 to 95 to represent positive values (0 to 4700 meters). The region selected represents a 6 Km resolution product.
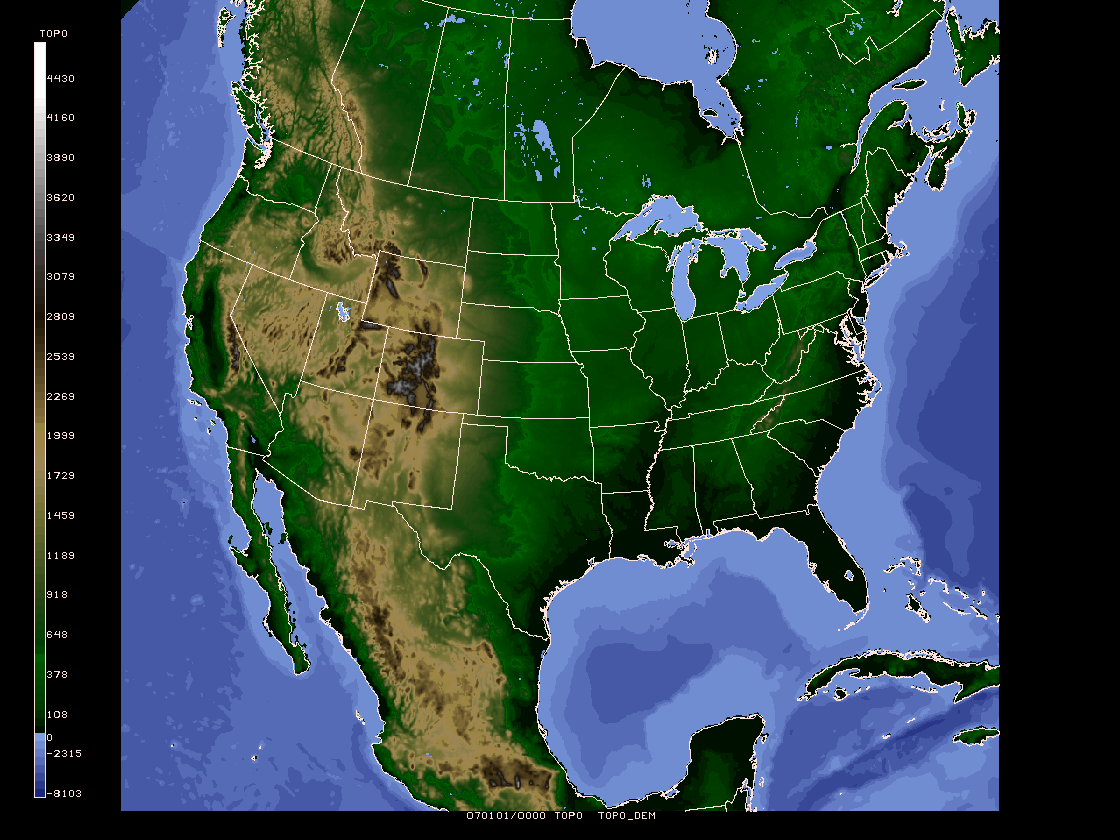
    GDATTIM  = last
    GDFILE   = nam_basemap.gem
    GLEVEL   = 0
    GVCORD   = none
    GFUNC    = topo
    SCALE    = 0
    PROJ     = str/90;-97;0
    GRDAREA  = 15;-116;50;-51.95
    KXKY     = 1002;925
    CPYFIL   =
    SATFIL   = nam_basemap.gini
    CALINFO  = 99/3/TOPO,0,7,-8103,0;8,95,0,4700
    WMOHDR   = TICZ99/CHIZ/
    GEMPAK-GD2IMG>r
TOPO TOPO_DEM5 0 94 11 4 1 upc_dem5.tbl
    MAP      = 1
    GAREA    = dset
    PROJ     = sat
    SATFIL   = nam_basemap.gini
    LUTFIL   = upc_dem5.tbl