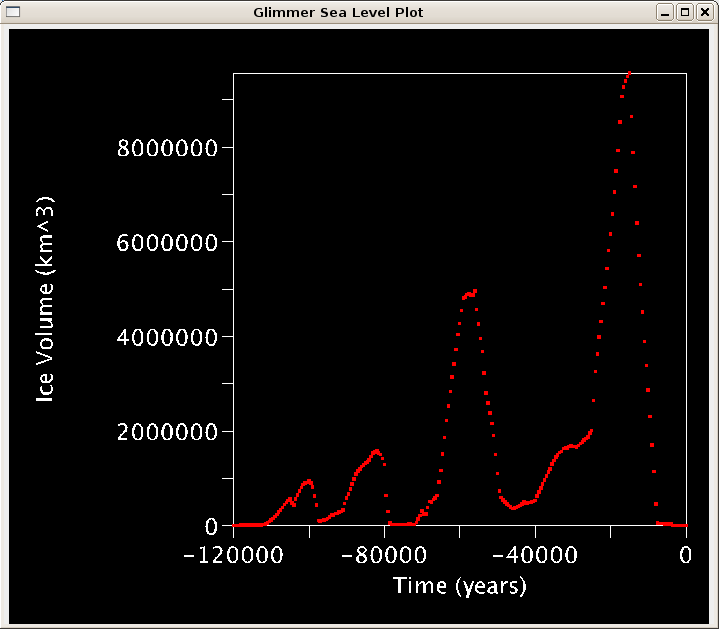
Hello again,

I was wondering if there is anyway I can tell visAD to make the best
use of available space.  By default, it appears to align the box (I'm
doing a 2D plot) in the center of the space at a reasonable size for
the window.  However, when y-axis labels are long this forces the
y-axis title off the screen.  Is there anyway I could get it to center
based on all ink on screen?  Also, can I tell it to make the best use
of space so it makes the plot bigger and puts everything in the
center.  I've included a screenshot of the default behavior and a
screenshot of what I'd like it to look like.

Also, a separate but related note, I'm  having issues with things
associated with the axes not rendering.  Sometimes I run it and there
is nothing but a y-axis title -- no tick marks or labels, but the
x-axis is fine.  Other times the opposite occurs.  Very rarely (it
took me 7 "trys" to obtain the screenshots) does everything render as
expected.  Has anyone encountered behavior like this?

James
Attachment:
default.png
Description: PNG image
Attachment:
preferred.png
Description: PNG image
visad archives: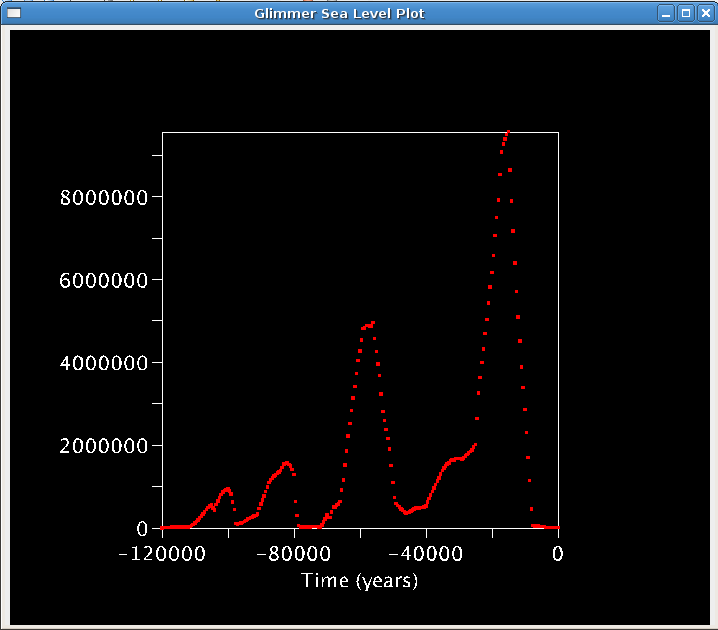