hullo again everybody,

this will probably sound familiar to some of you (hi bill!), but i've
been sicced back onto this project, so it's time to attack it again.

we have this landscape model...it outputs data...we want to animate it.
the model outputs netCDF, some data are 3D, some 2D. right now we're
interested in two of the 2D layers: elevation and water depth. (i know
that those *sound* like 3D layers, but they're not: at any given point
in the 2D grid, there is one and only one elevation value, likewise for
water depth).

what we'd like to do is generate images that look like the attached -- a
topo surface, with each grid poly color-coded for water depth. (the
little legend bar is nice, but not crucial.) for what it's worth, this
graphic was generated in MATLAB.

when i tried to do this in visad before, i managed to get displays that
showed topography, and could get a display color-coding the water, but i
couldn't map the latter onto the former as seen here.

am i working against the grain of visad here? if not, can somebody
suggest an initial line of investigation?

TIA,

rw
Attachment:
smaller_topomap.jpg
Description: JPEG image
visad archives: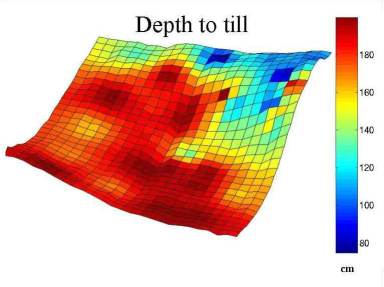